
- Startseite >
- Flüsse >
- Abfluss >
- Bayern >
- Kempten >
- Jahresgrafik

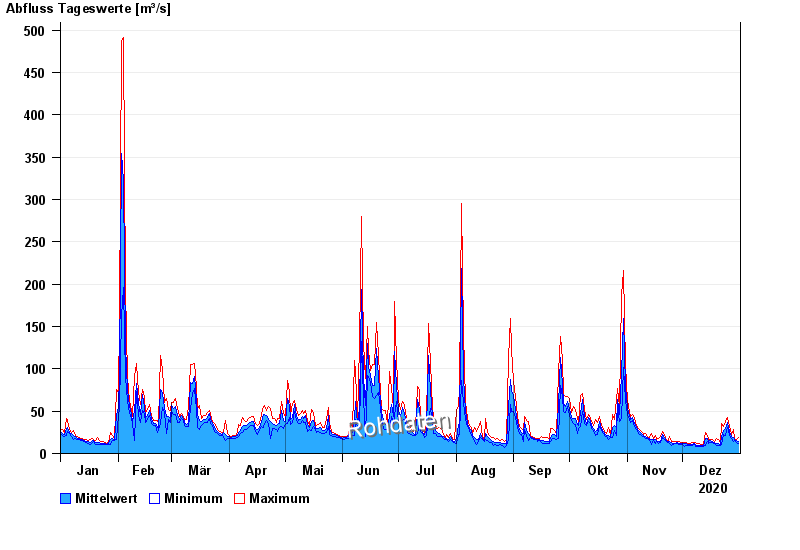
Jahresgrafik Kempten / Iller
Abfluss vom 01.01.2020 bis zum 31.12.2020
| Datum | Mittelwert [m³/s] | Maximum [m³/s] | Minimum [m³/s] |
|---|---|---|---|
| 31.12.2020 | 14,2 | 18,5 | 11,7 |
| 30.12.2020 | 15,1 | 16,5 | 13,4 |
| 29.12.2020 | 16,5 | 18 | 15,5 |
| 28.12.2020 | 18,6 | 28,8 | 14,2 |
| 27.12.2020 | 20 | 22,4 | 18 |
| 26.12.2020 | 26,2 | 31,5 | 21,8 |
| 25.12.2020 | 37 | 42,9 | 30,8 |
© Bayerisches Landesamt für Umwelt 2025