
- Startseite >
- Flüsse >
- Abfluss >
- Bayern >
- Kollbach >
- Jahresgrafik

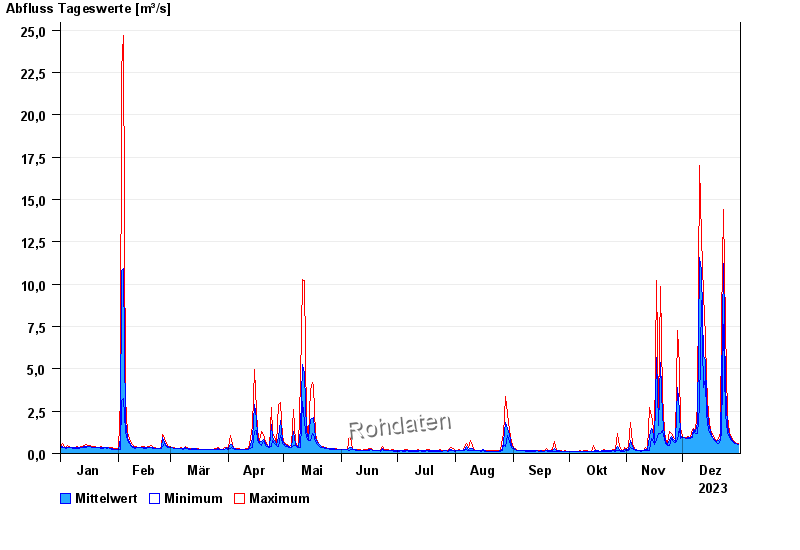
Jahresgrafik Kollbach / Kollbach
Abfluss vom 01.01.2023 bis zum 31.12.2023
| Datum | Mittelwert [m³/s] | Maximum [m³/s] | Minimum [m³/s] |
|---|---|---|---|
| 31.12.2023 | 0,546 | 0,617 | 0,538 |
| 30.12.2023 | 0,584 | 0,617 | 0,577 |
| 29.12.2023 | 0,644 | 0,699 | 0,617 |
| 28.12.2023 | 0,714 | 0,787 | 0,658 |
| 27.12.2023 | 0,835 | 0,922 | 0,787 |
| 26.12.2023 | 1,09 | 1,25 | 0,922 |
| 25.12.2023 | 1,66 | 2,23 | 1,25 |
© Bayerisches Landesamt für Umwelt 2025