
- Startseite >
- Flüsse >
- Abfluss >
- Bayern >
- Oberlauter >
- Jahresgrafik

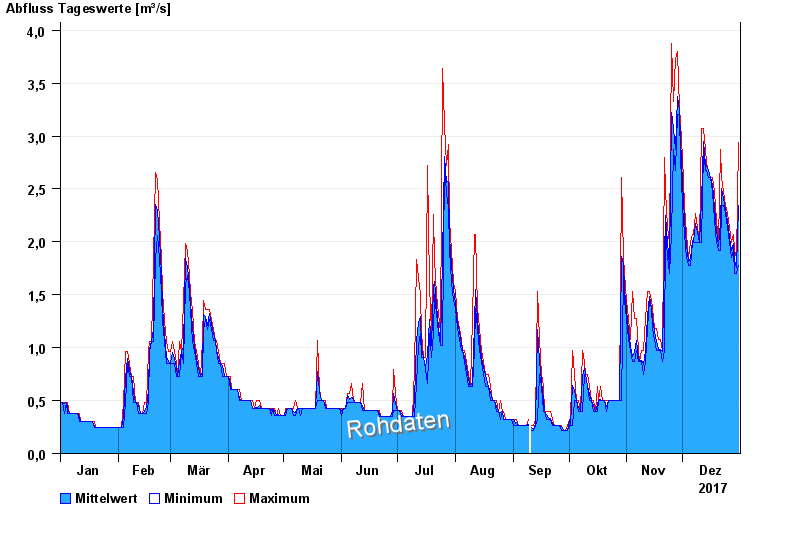
Jahresgrafik Oberlauter / Lauterbach
Abfluss vom 01.01.2017 bis zum 31.12.2017
| Datum | Mittelwert [m³/s] | Maximum [m³/s] | Minimum [m³/s] |
|---|---|---|---|
| 31.12.2017 | 2,34 | 2,94 | 1,78 |
| 30.12.2017 | 1,76 | 1,85 | 1,7 |
| 29.12.2017 | 1,82 | 1,92 | 1,7 |
| 28.12.2017 | 1,98 | 2,07 | 1,92 |
| 27.12.2017 | 1,92 | 1,99 | 1,85 |
| 26.12.2017 | 2,04 | 2,14 | 1,99 |
| 25.12.2017 | 2,19 | 2,27 | 2,14 |
© Bayerisches Landesamt für Umwelt 2025