
- Startseite >
- Flüsse >
- Abfluss >
- Bayern >
- Pettstadt >
- Jahresgrafik

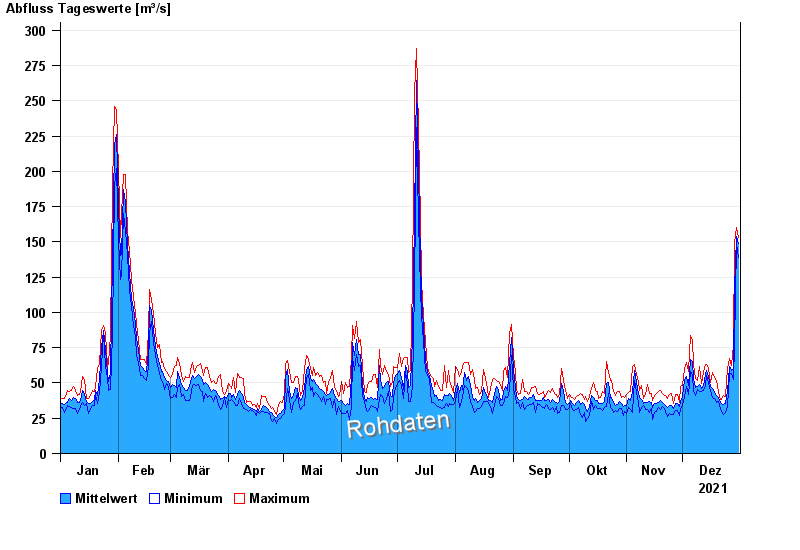
Jahresgrafik Pettstadt / Regnitz
Abfluss vom 01.01.2021 bis zum 31.12.2021
| Datum | Mittelwert [m³/s] | Maximum [m³/s] | Minimum [m³/s] |
|---|---|---|---|
| 31.12.2021 | 149 | 153 | 139 |
| 30.12.2021 | 154 | 160 | 149 |
| 29.12.2021 | 116 | 149 | 76,5 |
| 28.12.2021 | 59,3 | 76,5 | 52,4 |
| 27.12.2021 | 58,8 | 62,3 | 56,8 |
| 26.12.2021 | 62 | 67 | 56,8 |
| 25.12.2021 | 44,2 | 60,5 | 33,2 |
© Bayerisches Landesamt für Umwelt 2025