
- Startseite >
- Flüsse >
- Abfluss >
- Bayern >
- Römershofen >
- Jahresgrafik

Jahresgrafik Römershofen / Nassach
Abfluss vom 01.01.2022 bis zum 31.12.2022
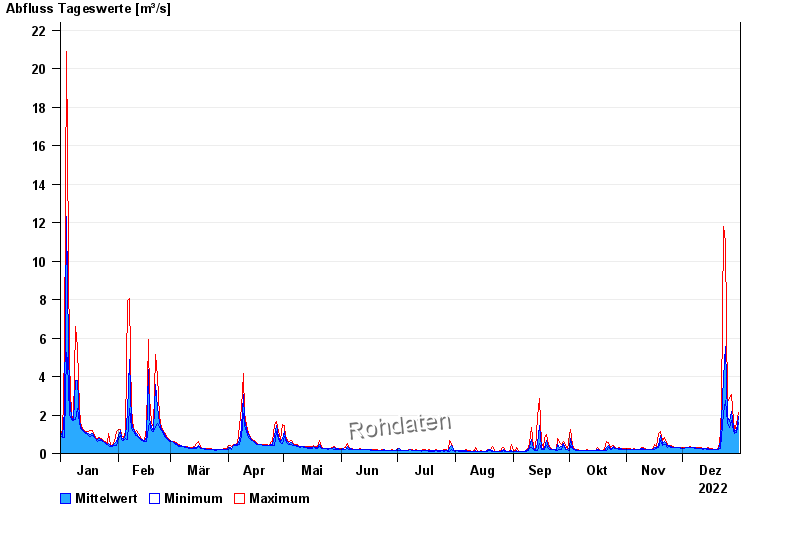
| Datum | Mittelwert [m³/s] | Maximum [m³/s] | Minimum [m³/s] |
|---|---|---|---|
| 31.12.2022 | 1,91 | 2,13 | 1,63 |
| 30.12.2022 | 1,22 | 1,57 | 1,11 |
| 29.12.2022 | 1,12 | 1,22 | 1,05 |
| 28.12.2022 | 1,42 | 1,69 | 1,22 |
| 27.12.2022 | 2,19 | 3,05 | 1,69 |
| 26.12.2022 | 1,64 | 2,86 | 1,34 |
| 25.12.2022 | 1,92 | 2,67 | 1,63 |
© Bayerisches Landesamt für Umwelt 2025