
- Startseite >
- Flüsse >
- Abfluss >
- Oberer Main - Elbe >
- Grafenwöhr >
- Jahresgrafik

Jahresgrafik Grafenwöhr / Creußen
Abfluss vom 01.01.2019 bis zum 31.12.2019
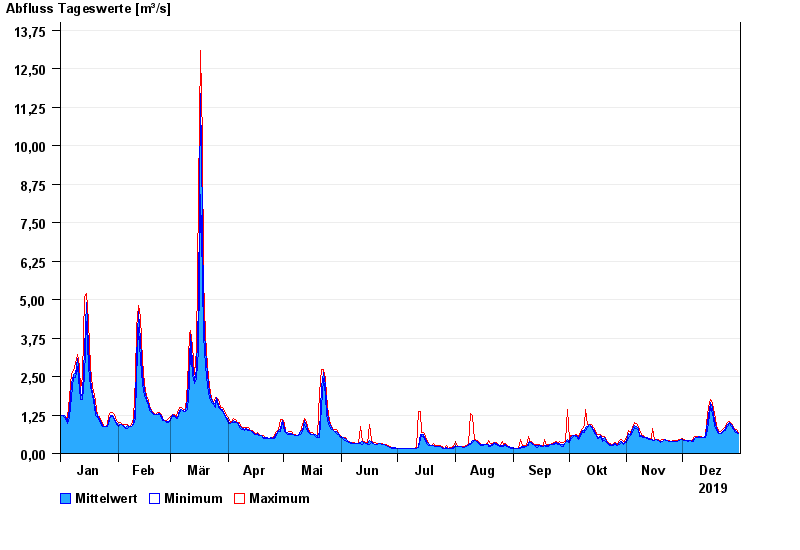
| Datum | Mittelwert [m³/s] | Maximum [m³/s] | Minimum [m³/s] |
|---|---|---|---|
| 31.12.2019 | 0,66 | 0,698 | 0,646 |
| 30.12.2019 | 0,709 | 0,791 | 0,688 |
| 29.12.2019 | 0,772 | 0,79 | 0,729 |
| 28.12.2019 | 0,825 | 0,877 | 0,775 |
| 27.12.2019 | 0,945 | 0,983 | 0,874 |
| 26.12.2019 | 1,01 | 1,03 | 0,973 |
| 25.12.2019 | 0,935 | 1,02 | 0,886 |
© Bayerisches Landesamt für Umwelt 2025