
- Startseite >
- Flüsse >
- Abfluss >
- Inn >
- Oberaudorf >
- Jahresgrafik

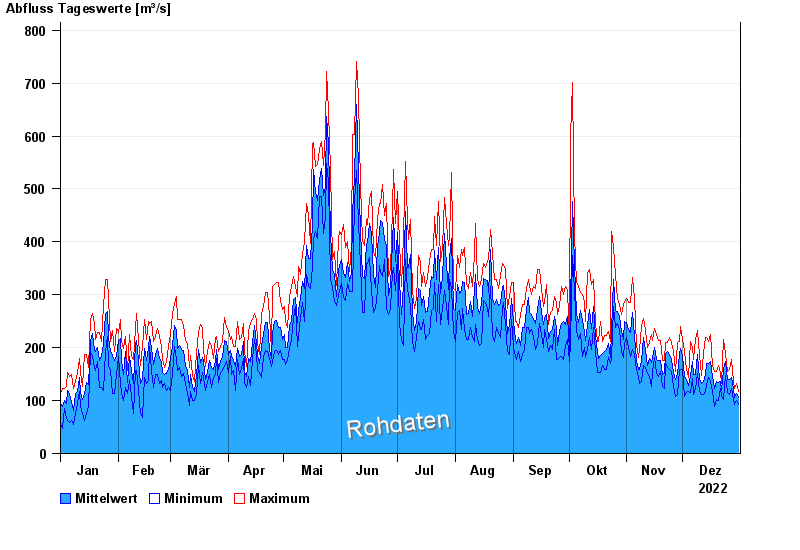
Jahresgrafik Oberaudorf / Inn
Abfluss vom 01.01.2022 bis zum 31.12.2022
| Datum | Mittelwert [m³/s] | Maximum [m³/s] | Minimum [m³/s] |
|---|---|---|---|
| 31.12.2022 | 105 | 118 | 92,9 |
| 30.12.2022 | 113 | 133 | 100 |
| 29.12.2022 | 105 | 122 | 92,9 |
| 28.12.2022 | 123 | 137 | 103 |
| 27.12.2022 | 143 | 178 | 122 |
| 26.12.2022 | 139 | 159 | 111 |
| 25.12.2022 | 139 | 155 | 115 |
© Bayerisches Landesamt für Umwelt 2025