
- Startseite >
- Flüsse >
- Abfluss >
- Isar >
- Garmisch u. d. Partnachmündung >
- Monatsgrafik

Monatsgrafik Garmisch u. d. Partnachmündung / Loisach
Abfluss vom 01.10.2024 bis zum 30.10.2024
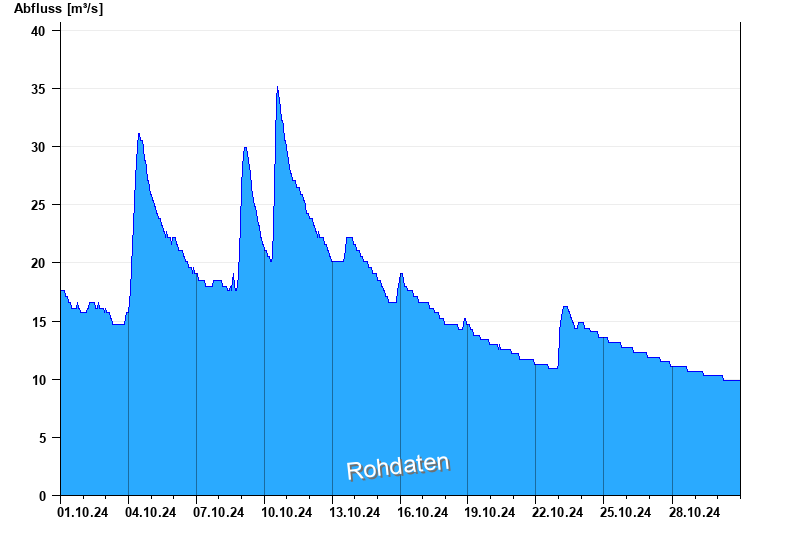
Hinweis
Messwerte beeinflusst durch Kraftwerkssteuerung.
| Datum | Abfluss [m³/s] |
|---|---|
| 30.10.2024 23:45 | 9,93 |
| 30.10.2024 23:30 | 9,93 |
| 30.10.2024 23:15 | 9,93 |
| 30.10.2024 23:00 | 9,93 |
| 30.10.2024 22:45 | 9,93 |
| 30.10.2024 22:30 | 9,93 |
| 30.10.2024 22:15 | 9,93 |
© Bayerisches Landesamt für Umwelt 2025