
- Startseite >
- Flüsse >
- Abfluss >
- Isar >
- Großschwindau >
- Jahresgrafik

Jahresgrafik Großschwindau / Goldach
Abfluss vom 01.01.2020 bis zum 31.12.2020
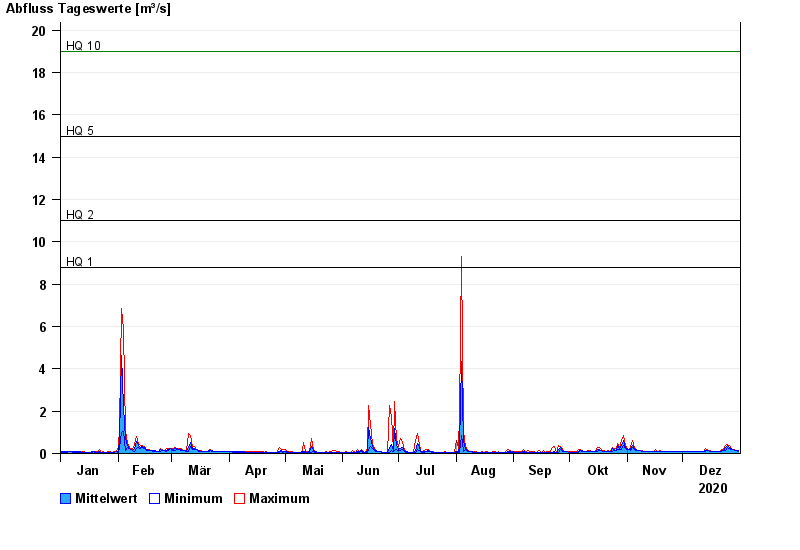
- HQ1 8,8 m³/s
- HQ2 11 m³/s
- HQ5 15 m³/s
- HQ10 19 m³/s
- HQ20 22 m³/s
- HQ50 26 m³/s
- HQ100 29 m³/s
| Datum | Mittelwert [m³/s] | Maximum [m³/s] | Minimum [m³/s] |
|---|---|---|---|
| 31.12.2020 | 0,122 | 0,123 | 0,109 |
| 30.12.2020 | 0,126 | 0,137 | 0,123 |
| 29.12.2020 | 0,148 | 0,168 | 0,137 |
| 28.12.2020 | 0,179 | 0,202 | 0,168 |
| 27.12.2020 | 0,215 | 0,239 | 0,202 |
| 26.12.2020 | 0,293 | 0,396 | 0,239 |
| 25.12.2020 | 0,379 | 0,446 | 0,28 |
© Bayerisches Landesamt für Umwelt 2025