
- Startseite >
- Flüsse >
- Abfluss >
- Isar >
- Plattling >
- Jahresgrafik

Jahresgrafik Plattling / Isar
Abfluss vom 27.11.2020 bis zum 26.11.2021
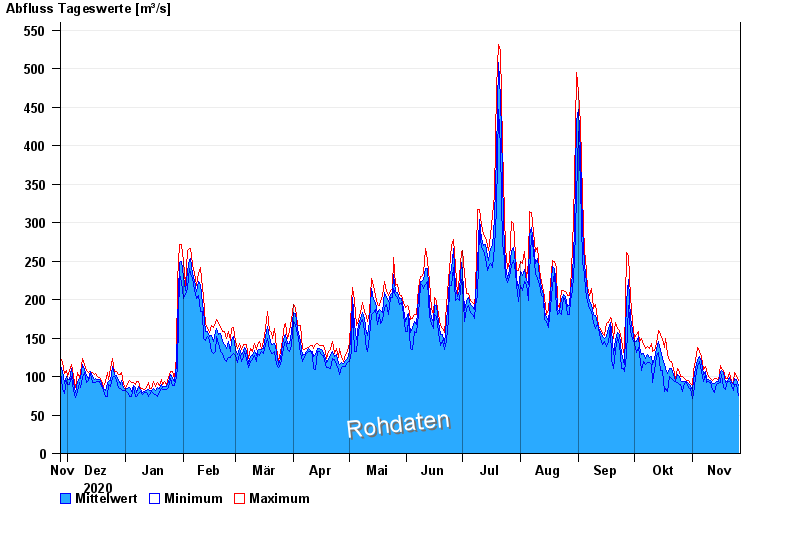
| Datum | Mittelwert [m³/s] | Maximum [m³/s] | Minimum [m³/s] |
|---|---|---|---|
| 26.11.2021 | 106 | 113 | 92,2 |
| 25.11.2021 | 114 | 118 | 107 |
| 24.11.2021 | 114 | 123 | 107 |
| 23.11.2021 | 106 | 110 | 99,2 |
| 22.11.2021 | 109 | 111 | 104 |
| 21.11.2021 | 116 | 122 | 111 |
| 20.11.2021 | 112 | 114 | 111 |
© Bayerisches Landesamt für Umwelt 2025