
- Startseite >
- Flüsse >
- Abfluss >
- Obere Donau >
- Dachau >
- Jahresgrafik

Jahresgrafik Dachau / Gröbenbach
Abfluss vom 27.11.2020 bis zum 26.11.2021
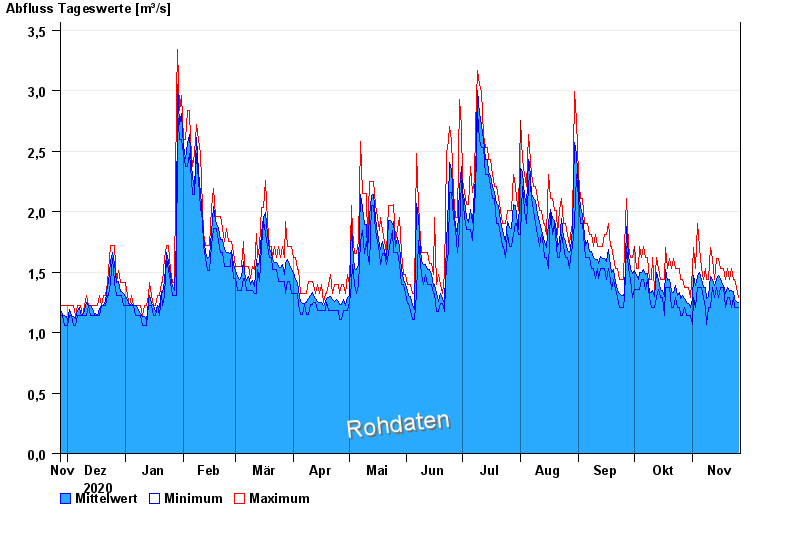
| Datum | Mittelwert [m³/s] | Maximum [m³/s] | Minimum [m³/s] |
|---|---|---|---|
| 26.11.2021 | 1,25 | 1,29 | 1,21 |
| 25.11.2021 | 1,26 | 1,37 | 1,21 |
| 24.11.2021 | 1,27 | 1,44 | 1,21 |
| 23.11.2021 | 1,34 | 1,44 | 1,29 |
| 22.11.2021 | 1,35 | 1,53 | 1,21 |
| 21.11.2021 | 1,34 | 1,44 | 1,29 |
| 20.11.2021 | 1,37 | 1,53 | 1,29 |
© Bayerisches Landesamt für Umwelt 2025