
- Startseite >
- Flüsse >
- Abfluss >
- Naab - Regen >
- Trausnitz u. d. Mühle >
- Jahresgrafik

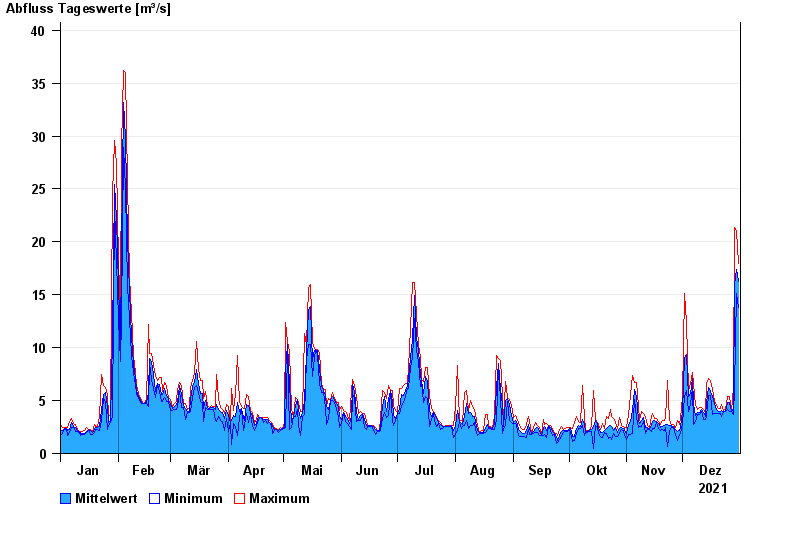
Jahresgrafik Trausnitz u. d. Mühle / Pfreimd
Abfluss vom 01.01.2021 bis zum 31.12.2021
| Datum | Mittelwert [m³/s] | Maximum [m³/s] | Minimum [m³/s] |
|---|---|---|---|
| 31.12.2021 | 16,3 | 18 | 13,8 |
| 30.12.2021 | 17,4 | 21,1 | 15,1 |
| 29.12.2021 | 15,9 | 21,4 | 6,17 |
| 28.12.2021 | 4,28 | 6,37 | 3,65 |
| 27.12.2021 | 3,96 | 3,97 | 3,96 |
| 26.12.2021 | 4,81 | 5,41 | 3,96 |
| 25.12.2021 | 4,78 | 5,4 | 4,13 |
© Bayerisches Landesamt für Umwelt 2025