
- Startseite >
- Flüsse >
- Chemie >
- Bayern >
- oh. Brücke Moosmühle >
- Jahresgrafik

Jahresgrafik oh. Brücke Moosmühle / Isen
Daten vom 2009-12-08 bis zum 2010-12-07
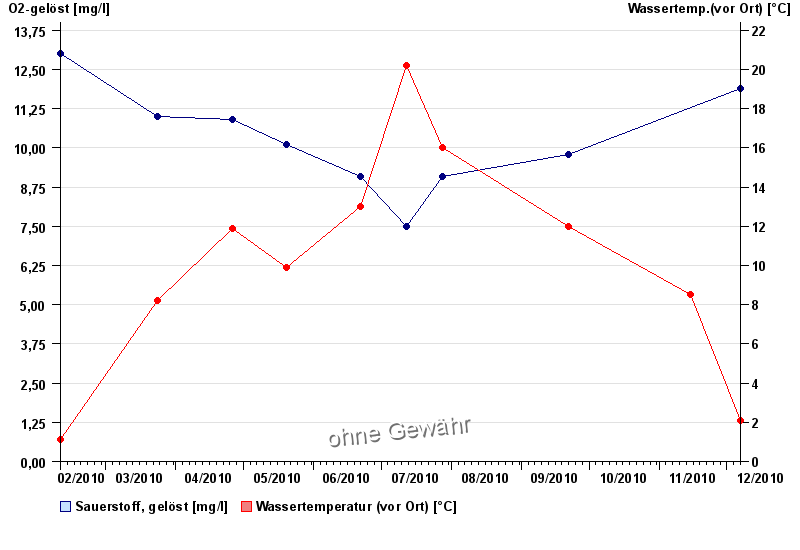
| Datum | O2-gelöst [mg/l] | Wassertemp.(vor Ort) [°C] |
|---|---|---|
| 07.12.2010 | 11,9 | 2,1 |
| 15.11.2010 | -- | 8,5 |
| 22.09.2010 | 9,8 | 12 |
| 28.07.2010 | 9,1 | 16 |
| 12.07.2010 | 7,5 | 20,2 |
| 22.06.2010 | 9,1 | 13 |
| 20.05.2010 | 10,1 | 9,9 |
© Bayerisches Landesamt für Umwelt 2025