
- Startseite >
- Flüsse >
- Chemie >
- Bayern >
- u.h. Micheleckmuehle >
- Jahresgrafik

Jahresgrafik u.h. Micheleckmuehle / Große Mühl
Daten vom 2017-01-01 bis zum 2017-12-31
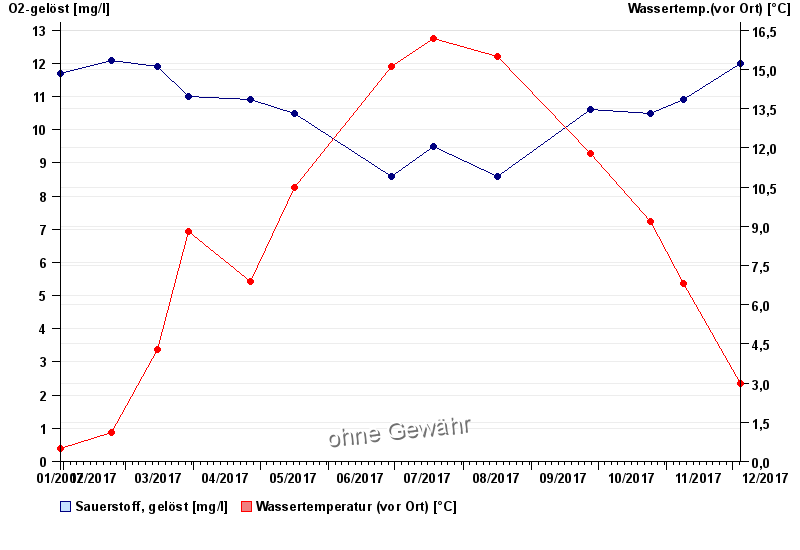
| Datum | O2-gelöst [mg/l] | Wassertemp.(vor Ort) [°C] |
|---|---|---|
| 04.12.2017 | 12 | 3 |
| 08.11.2017 | 10,9 | 6,8 |
| 24.10.2017 | 10,5 | 9,2 |
| 27.09.2017 | 10,6 | 11,8 |
| 16.08.2017 | 8,6 | 15,5 |
| 18.07.2017 | 9,5 | 16,2 |
| 29.06.2017 | 8,6 | 15,1 |
© Bayerisches Landesamt für Umwelt 2025