
- Startseite >
- Flüsse >
- Chemie >
- Isar >
- uh Staustufe 14 (Chemiemesstelle) >
- Jahresgrafik

Jahresgrafik uh Staustufe 14 (Chemiemesstelle) / Lech
Daten vom 2017-01-01 bis zum 2017-12-31
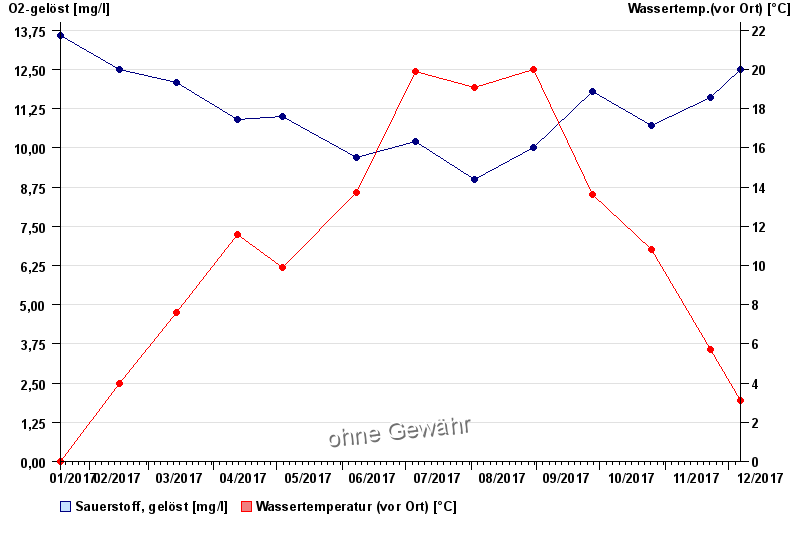
| Datum | O2-gelöst [mg/l] | Wassertemp.(vor Ort) [°C] |
|---|---|---|
| 06.12.2017 | 12,5 | 3,1 |
| 22.11.2017 | 11,6 | 5,7 |
| 25.10.2017 | 10,7 | 10,8 |
| 27.09.2017 | 11,8 | 13,6 |
| 30.08.2017 | 10 | 20 |
| 02.08.2017 | 9 | 19,1 |
| 05.07.2017 | 10,2 | 19,9 |
© Bayerisches Landesamt für Umwelt 2025