
- Startseite >
- Flüsse >
- Chemie >
- Obere Donau >
- 500m uh KA Walkertshofen >
- Jahresgrafik

Jahresgrafik 500m uh KA Walkertshofen / Neufnach
Daten vom 2018-01-01 bis zum 2018-12-31
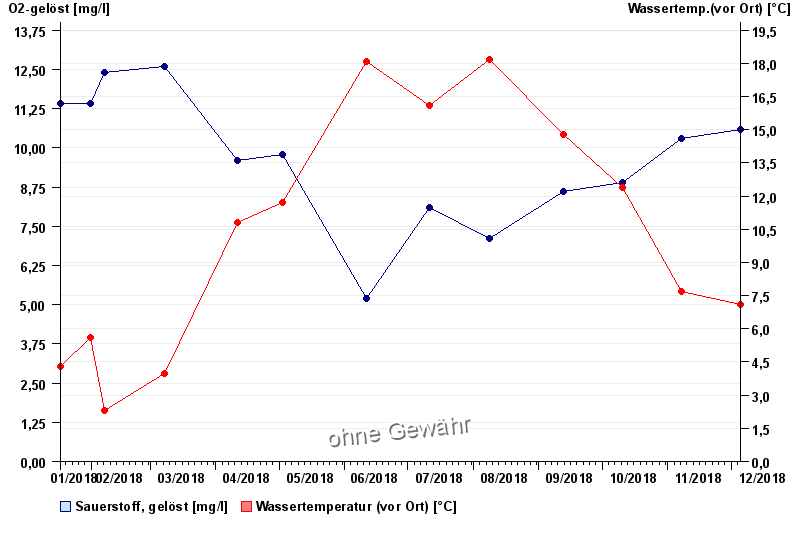
| Datum | O2-gelöst [mg/l] | Wassertemp.(vor Ort) [°C] |
|---|---|---|
| 05.12.2018 | 10,6 | 7,1 |
| 07.11.2018 | 10,3 | 7,7 |
| 10.10.2018 | 8,9 | 12,4 |
| 12.09.2018 | 8,6 | 14,8 |
| 08.08.2018 | 7,1 | 18,2 |
| 11.07.2018 | 8,1 | 16,1 |
| 11.06.2018 | 5,2 | 18,1 |
© Bayerisches Landesamt für Umwelt 2025