
- Startseite >
- Flüsse >
- Schwebstoff >
- Bayern >
- Aunkofen >
- Jahresgrafik

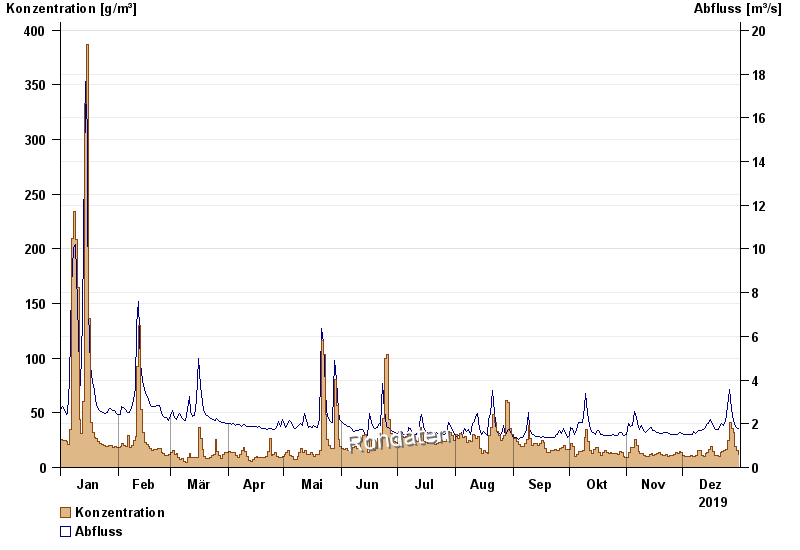
Jahresgrafik Aunkofen / Abens
Schwebstoff vom 01.01.2019 bis zum 31.12.2019
| Datum | Konzentration [g/m³] | Abfluss [m³/s] |
|---|---|---|
| 31.12.2019 | 11,8 | 1,77 |
| 30.12.2019 | 15,1 | 1,82 |
| 29.12.2019 | 19,2 | 1,96 |
| 28.12.2019 | 32,3 | 2,16 |
| 27.12.2019 | 35,7 | 2,64 |
| 26.12.2019 | 40,9 | 3,57 |
| 25.12.2019 | 24,6 | 2,79 |
© Bayerisches Landesamt für Umwelt 2025