
- Startseite >
- Flüsse >
- Schwebstoff >
- Bayern >
- Eschelbach >
- Jahresgrafik

Jahresgrafik Eschelbach / Inn
Schwebstoff vom 01.01.2018 bis zum 31.12.2018
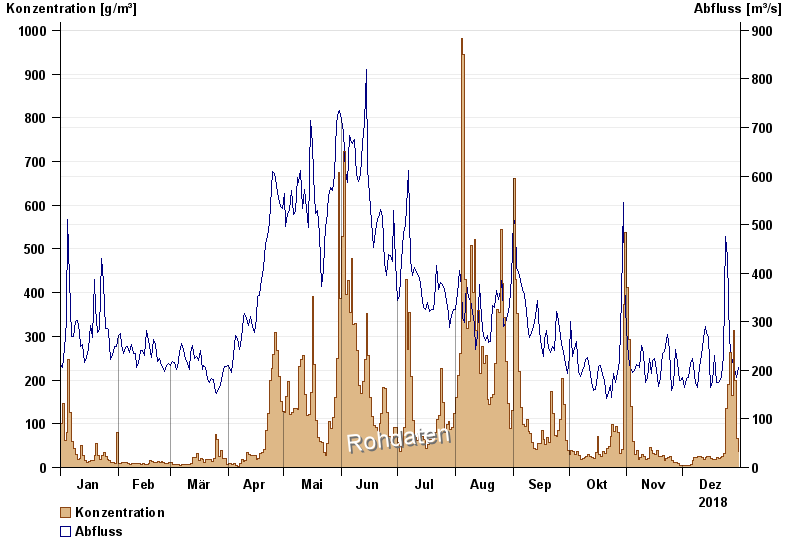
| Datum | Konzentration [g/m³] | Abfluss [m³/s] |
|---|---|---|
| 31.12.2018 | 35,8 | 206 |
| 30.12.2018 | 67,1 | 186 |
| 29.12.2018 | 198,1 | 202 |
| 28.12.2018 | 313,5 | 209 |
| 27.12.2018 | 163,8 | 229 |
| 26.12.2018 | 262,8 | 262 |
| 25.12.2018 | 189,9 | 433 |
© Bayerisches Landesamt für Umwelt 2025