
- Startseite >
- Flüsse >
- Schwebstoff >
- Bayern >
- Heitzenhofen >
- Jahresgrafik

Jahresgrafik Heitzenhofen / Naab
Schwebstoff vom 01.01.2018 bis zum 31.12.2018
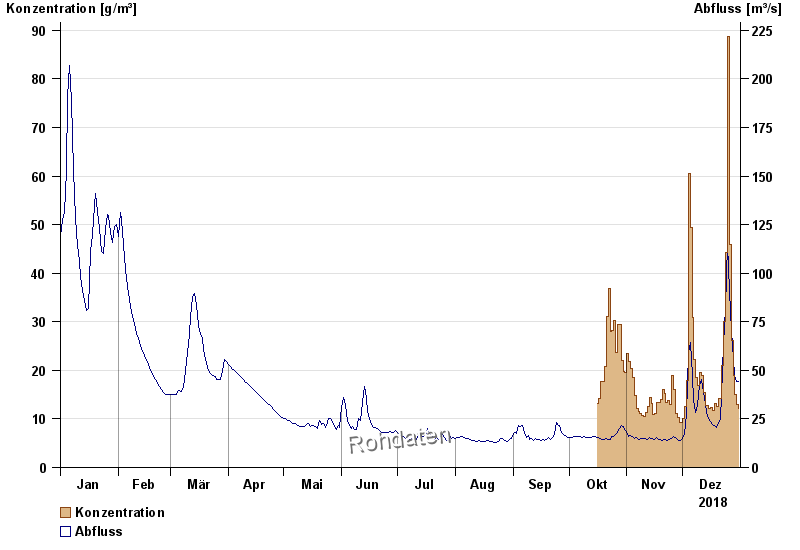
| Datum | Konzentration [g/m³] | Abfluss [m³/s] |
|---|---|---|
| 31.12.2018 | 12,1 | 44,1 |
| 30.12.2018 | 13,0 | 44,5 |
| 29.12.2018 | 14,9 | 47,2 |
| 28.12.2018 | 19,0 | 56,1 |
| 27.12.2018 | 26,1 | 70,2 |
| 26.12.2018 | 45,8 | 91,3 |
| 25.12.2018 | 88,7 | 115 |
© Bayerisches Landesamt für Umwelt 2025