
- Startseite >
- Flüsse >
- Schwebstoff >
- Bayern >
- Schlehdorf >
- Jahresgrafik

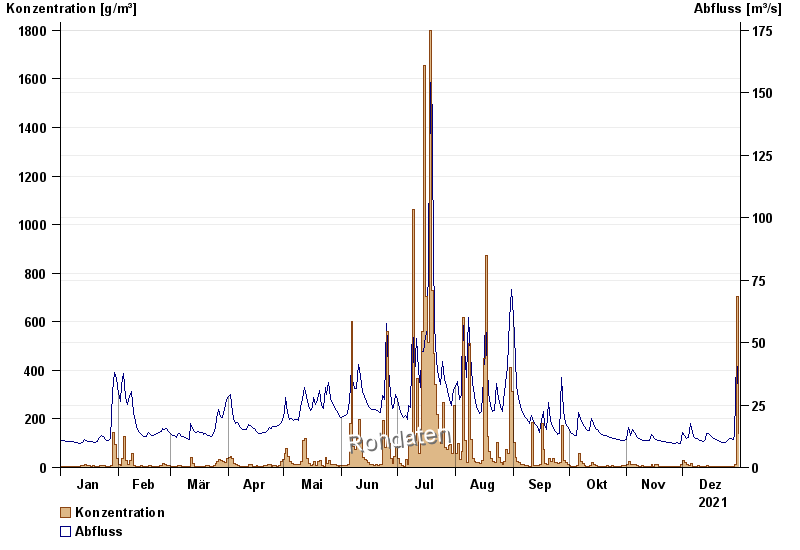
Jahresgrafik Schlehdorf / Loisach
Schwebstoff vom 01.01.2021 bis zum 31.12.2021
| Datum | Konzentration [g/m³] | Abfluss [m³/s] |
|---|---|---|
| 31.12.2021 | 141,0 | 29,8 |
| 30.12.2021 | 705,4 | 43,9 |
| 29.12.2021 | 14,4 | 12,9 |
| 28.12.2021 | 5,3 | 11,3 |
| 27.12.2021 | 4,7 | 11,8 |
| 26.12.2021 | 4,8 | 11,7 |
| 25.12.2021 | 4,4 | 10,7 |
© Bayerisches Landesamt für Umwelt 2025