
- Startseite >
- Flüsse >
- Schwebstoff >
- Oberer Main - Elbe >
- Behringersmühle >
- Jahresgrafik

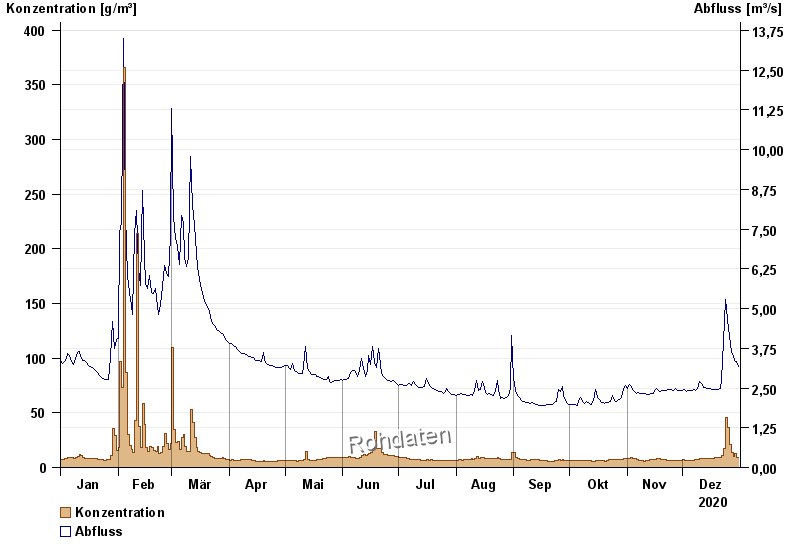
Jahresgrafik Behringersmühle / Wiesent
Schwebstoff vom 01.01.2020 bis zum 31.12.2020
| Datum | Konzentration [g/m³] | Abfluss [m³/s] |
|---|---|---|
| 31.12.2020 | 9,4 | 3,18 |
| 30.12.2020 | 9,0 | 3,33 |
| 29.12.2020 | 13,1 | 3,38 |
| 28.12.2020 | 10,1 | 3,5 |
| 27.12.2020 | 13,8 | 3,64 |
| 26.12.2020 | 21,0 | 4,11 |
| 25.12.2020 | 36,3 | 4,65 |
© Bayerisches Landesamt für Umwelt 2025