
- Startseite >
- Flüsse >
- Schwebstoff >
- Inn >
- Postmünster >
- Jahresgrafik

Jahresgrafik Postmünster / Rott
Schwebstoff vom 01.01.2018 bis zum 31.12.2018
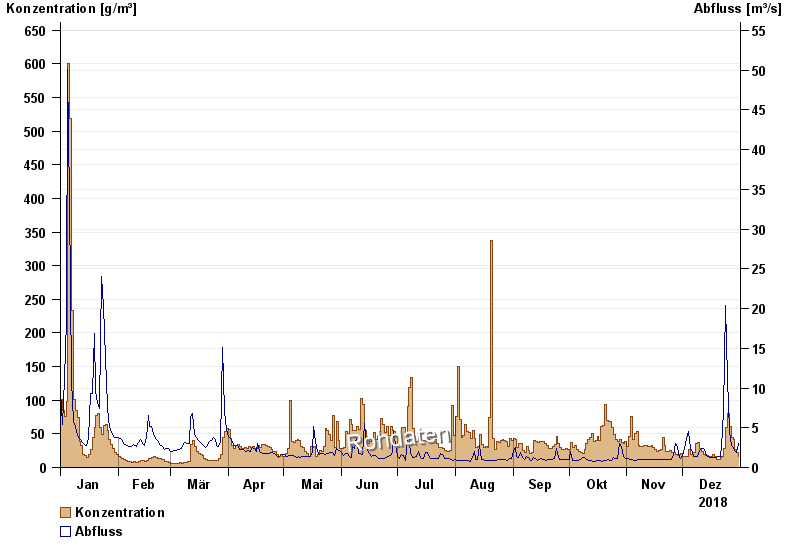
| Datum | Konzentration [g/m³] | Abfluss [m³/s] |
|---|---|---|
| 31.12.2018 | 15,8 | 2,96 |
| 30.12.2018 | 21,7 | 1,92 |
| 29.12.2018 | 27,5 | 2,15 |
| 28.12.2018 | 41,7 | 2,56 |
| 27.12.2018 | 45,0 | 2,74 |
| 26.12.2018 | 61,4 | 4,49 |
| 25.12.2018 | 80,5 | 11,2 |
© Bayerisches Landesamt für Umwelt 2025