
- Startseite >
- Flüsse >
- Schwebstoff >
- Isar >
- Eschelbach >
- Jahresgrafik

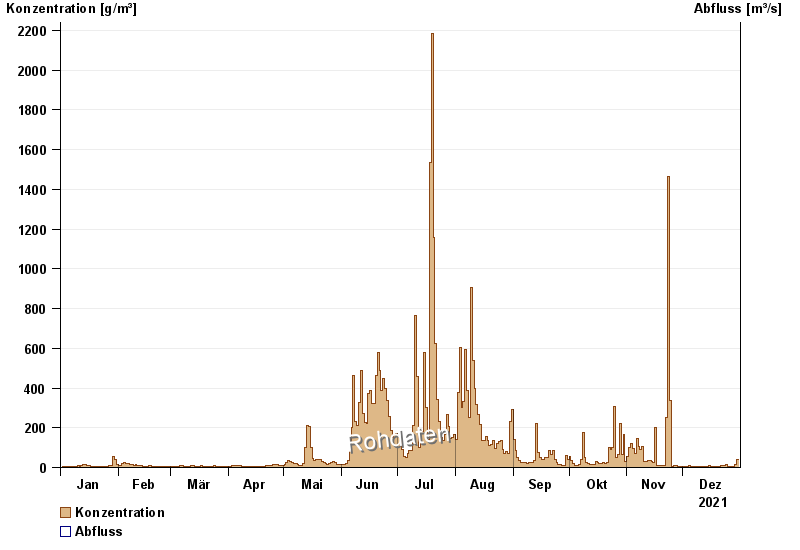
Jahresgrafik Eschelbach / Inn
Schwebstoff vom 01.01.2021 bis zum 31.12.2021
| Datum | Konzentration [g/m³] | Abfluss [m³/s] |
|---|---|---|
| 31.12.2021 | 26,4 | -- |
| 30.12.2021 | 28,8 | -- |
| 29.12.2021 | 11,0 | -- |
| 28.12.2021 | 7,8 | -- |
| 27.12.2021 | 8,3 | -- |
| 26.12.2021 | 7,7 | -- |
| 25.12.2021 | 6,0 | -- |
© Bayerisches Landesamt für Umwelt 2025