
- Startseite >
- Flüsse >
- Schwebstoff >
- Isar >
- Rosenheim o.d. Mangfallmündung >
- Jahresgrafik

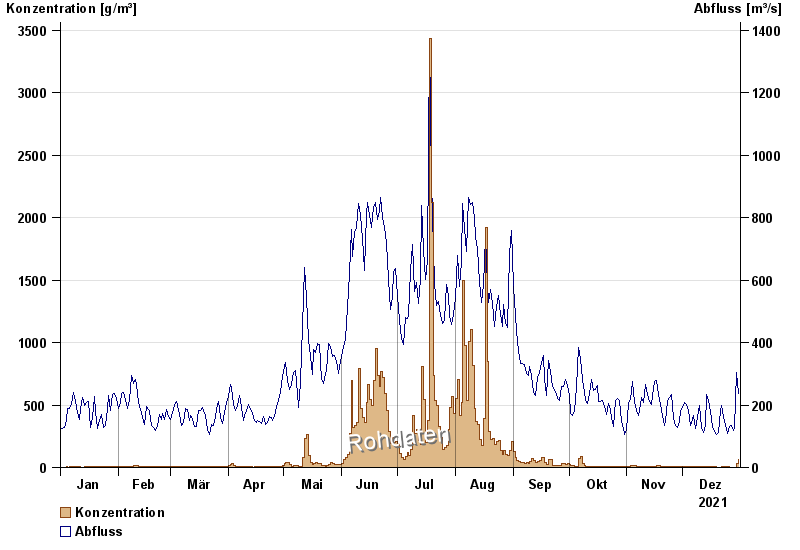
Jahresgrafik Rosenheim o.d. Mangfallmündung / Inn
Schwebstoff vom 01.01.2021 bis zum 31.12.2021
| Datum | Konzentration [g/m³] | Abfluss [m³/s] |
|---|---|---|
| 31.12.2021 | 66,6 | 253 |
| 30.12.2021 | 35,3 | 320 |
| 29.12.2021 | 2,5 | 140 |
| 28.12.2021 | 1,8 | 132 |
| 27.12.2021 | 2,3 | 149 |
| 26.12.2021 | 3,5 | 148 |
| 25.12.2021 | 4,7 | 123 |
© Bayerisches Landesamt für Umwelt 2025