
- Startseite >
- Flüsse >
- Schwebstoff >
- Obere Donau >
- Haslach Werksabfluss >
- Jahresgrafik

Jahresgrafik Haslach Werksabfluss / Wertach
Schwebstoff vom 01.01.2023 bis zum 31.12.2023
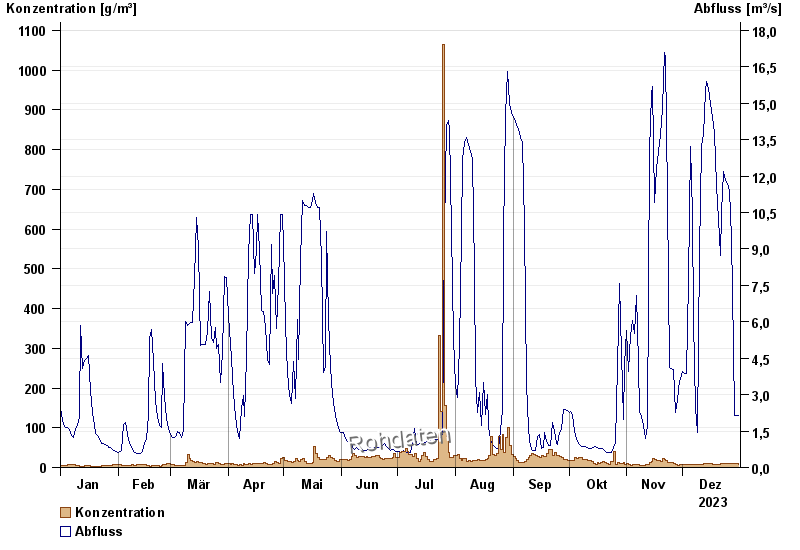
| Datum | Konzentration [g/m³] | Abfluss [m³/s] |
|---|---|---|
| 31.12.2023 | 8,8 | 2,14 |
| 30.12.2023 | 8,9 | 2,14 |
| 29.12.2023 | 8,9 | 2,14 |
| 28.12.2023 | 9,1 | 4,93 |
| 27.12.2023 | 9,3 | 9,46 |
| 26.12.2023 | 9,5 | 11,4 |
| 25.12.2023 | 9,9 | 11,7 |
© Bayerisches Landesamt für Umwelt 2024