
- Startseite >
- Flüsse >
- Schwebstoff >
- Unterer Main >
- Plattling >
- Monatsgrafik

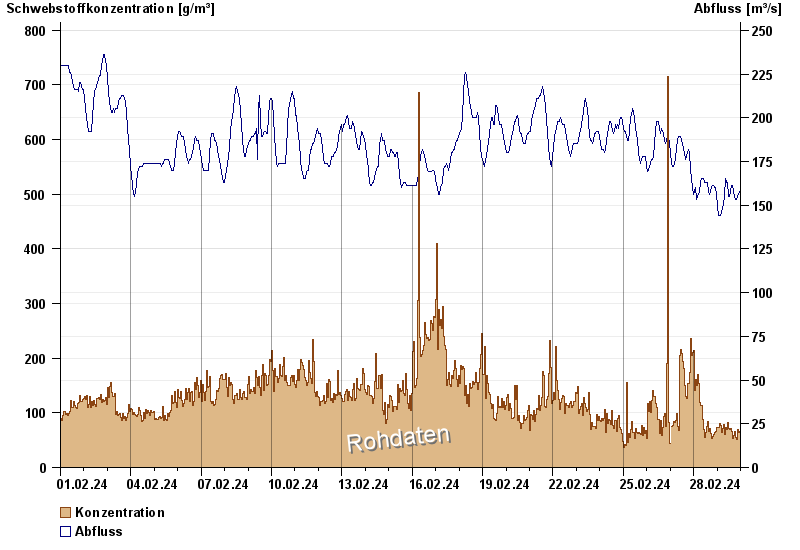
Monatsgrafik Plattling / Isar
Schwebstoff vom 01.02.2024 bis zum 29.02.2024
| Datum | Konzentration [g/m³] | Abfluss [m³/s] |
|---|---|---|
| 29.02.2024 23:45 | 61,5 | 158 |
| 29.02.2024 23:30 | 65,6 | 158 |
| 29.02.2024 23:15 | 66,6 | 156 |
| 29.02.2024 23:00 | 58,3 | 158 |
| 29.02.2024 22:45 | 59,1 | 156 |
| 29.02.2024 22:30 | 58,0 | 158 |
| 29.02.2024 22:15 | 48,9 | 156 |
© Bayerisches Landesamt für Umwelt 2024