
- Startseite >
- Flüsse >
- Schwebstoff >
- Unterer Main >
- Unterjettenberg >
- Jahresgrafik

Jahresgrafik Unterjettenberg / Saalach
Schwebstoff vom 01.01.2019 bis zum 31.12.2019
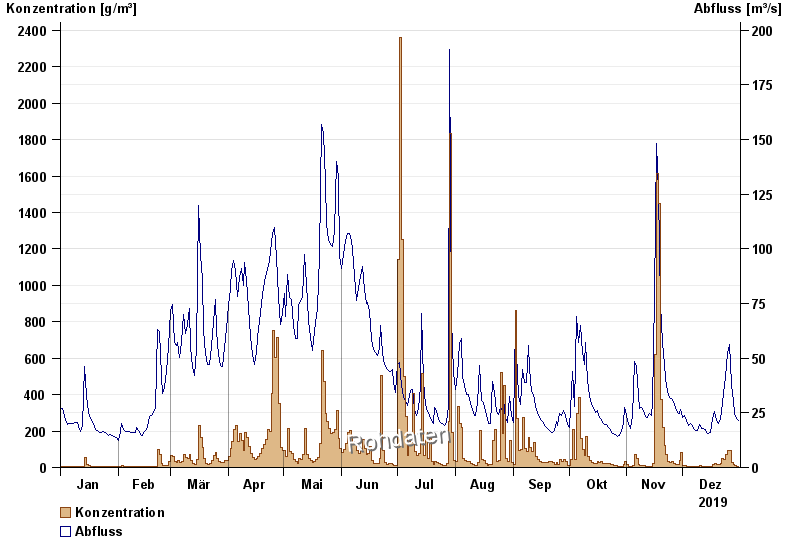
| Datum | Konzentration [g/m³] | Abfluss [m³/s] |
|---|---|---|
| 31.12.2019 | 6,3 | 21,4 |
| 30.12.2019 | 6,8 | 22,5 |
| 29.12.2019 | 9,0 | 24,9 |
| 28.12.2019 | 16,1 | 30,3 |
| 27.12.2019 | 29,2 | 38,1 |
| 26.12.2019 | 90,8 | 56,2 |
| 25.12.2019 | 92,6 | 52,3 |
© Bayerisches Landesamt für Umwelt 2025