
- Startseite >
- Flüsse >
- Wasserstand >
- Bayern >
- Aschau >
- Jahresgrafik

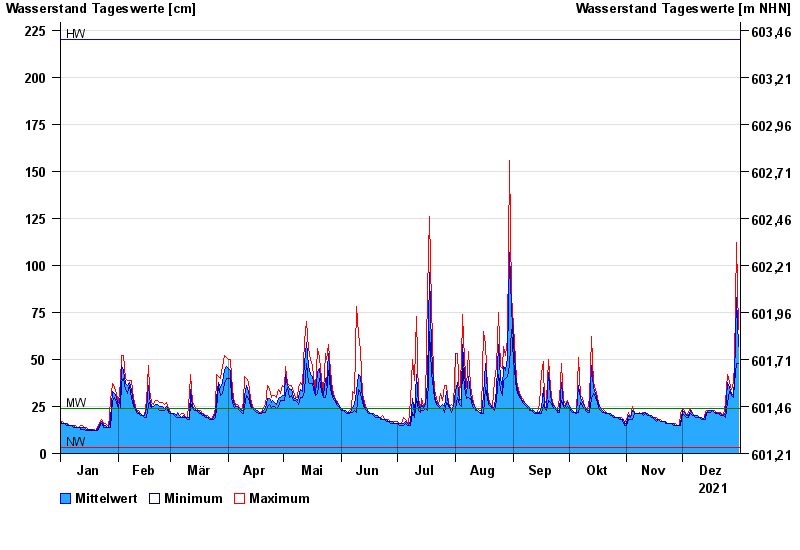
Jahresgrafik Aschau / Prien
Wasserstand vom 01.01.2021 bis zum 31.12.2021
| Datum | Mittelwert [cm] | Maximum [cm] | Minimum [cm] |
|---|---|---|---|
| 31.12.2021 | 57 | 66 | 48 |
| 30.12.2021 | 83 | 112 | 48 |
| 29.12.2021 | 40 | 48 | 37 |
| 28.12.2021 | 31 | 38 | 30 |
| 27.12.2021 | 32 | 34 | 31 |
| 26.12.2021 | 35 | 38 | 33 |
| 25.12.2021 | 38 | 42 | 27 |
© Bayerisches Landesamt für Umwelt 2025