
- Startseite >
- Flüsse >
- Wasserstand >
- Bayern >
- Bieberehren >
- Jahresgrafik

Jahresgrafik Bieberehren / Gollach
Wasserstand vom 01.01.2020 bis zum 31.12.2020
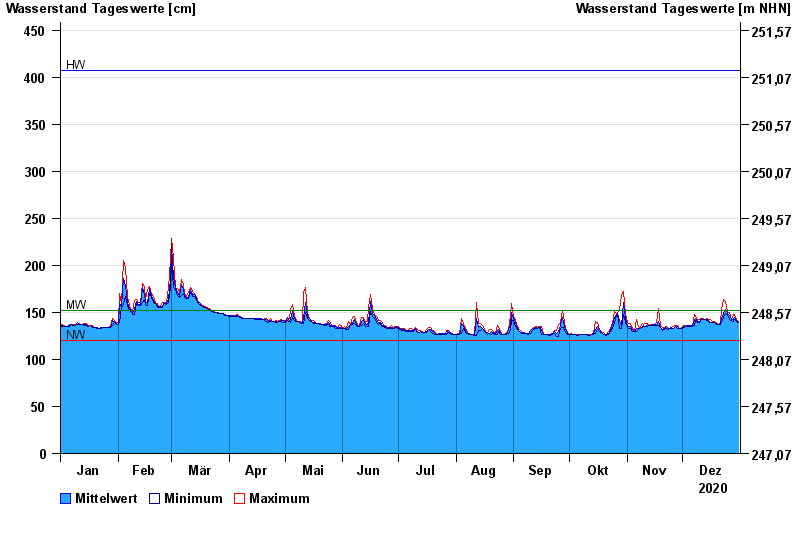
| Datum | Mittelwert [cm] | Maximum [cm] | Minimum [cm] |
|---|---|---|---|
| 31.12.2020 | 139 | 140 | 139 |
| 30.12.2020 | 141 | 142 | 140 |
| 29.12.2020 | 145 | 148 | 142 |
| 28.12.2020 | 142 | 148 | 140 |
| 27.12.2020 | 142 | 142 | 141 |
| 26.12.2020 | 147 | 150 | 142 |
| 25.12.2020 | 149 | 151 | 148 |
© Bayerisches Landesamt für Umwelt 2025