
- Startseite >
- Flüsse >
- Wasserstand >
- Bayern >
- Bockenfeld >
- Jahresgrafik

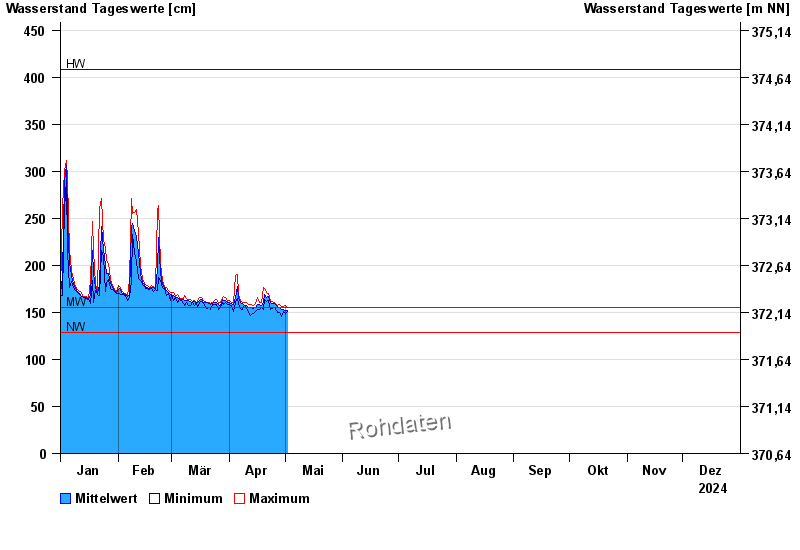
Jahresgrafik Bockenfeld / Tauber
Wasserstand vom 01.01.2024 bis zum 31.12.2024
Hinweis
Wasserstand und Abfluss wird zeitweise durch Biberdamm beeinflusst.
| Datum | Mittelwert [cm] | Maximum [cm] | Minimum [cm] |
|---|---|---|---|
| 31.12.2024 | 149 | 152 | 143 |
| 30.12.2024 | 149 | 151 | 148 |
| 29.12.2024 | 150 | 151 | 149 |
| 28.12.2024 | 151 | 152 | 149 |
| 27.12.2024 | 151 | 152 | 150 |
| 26.12.2024 | 152 | 155 | 151 |
| 25.12.2024 | 155 | 157 | 153 |
© Bayerisches Landesamt für Umwelt 2025