
- Startseite >
- Flüsse >
- Wasserstand >
- Bayern >
- Büg >
- Jahresgrafik

Jahresgrafik Büg / Schwabach
Wasserstand vom 01.01.2015 bis zum 31.12.2015
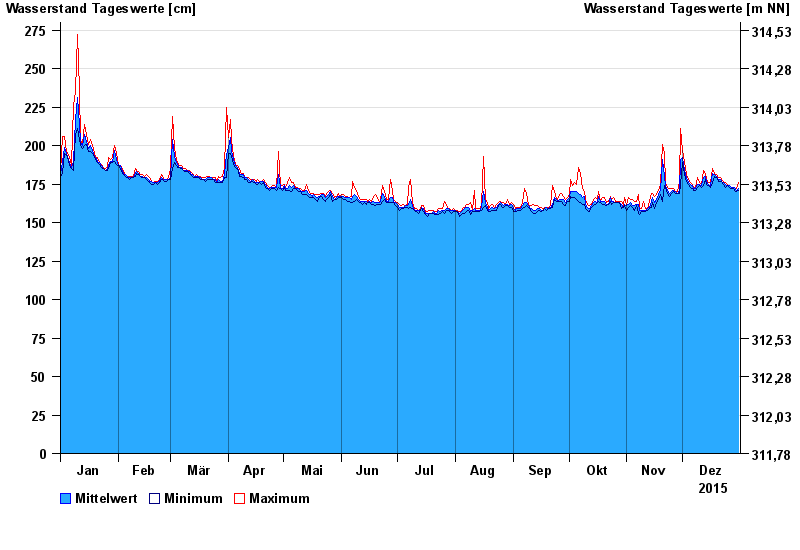
- 300 cm: Büg: Gefährdung der Brandner- und Frohnhofer Mühle, der Uttenreuther- und Buckenhofer Mühle.
| Datum | Mittelwert [cm] | Maximum [cm] | Minimum [cm] |
|---|---|---|---|
| 31.12.2015 | 172 | 176 | 171 |
| 30.12.2015 | 171 | 172 | 170 |
| 29.12.2015 | 173 | 173 | 171 |
| 28.12.2015 | 173 | 173 | 172 |
| 27.12.2015 | 173 | 173 | 172 |
| 26.12.2015 | 174 | 174 | 173 |
| 25.12.2015 | 174 | 175 | 174 |
© Bayerisches Landesamt für Umwelt 2025