
- Startseite >
- Flüsse >
- Wasserstand >
- Bayern >
- Coburg >
- Jahresgrafik

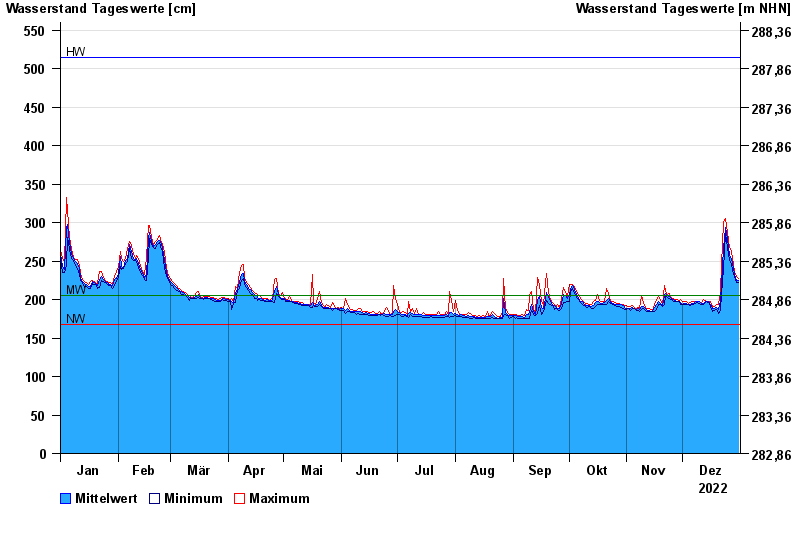
Jahresgrafik Coburg / Itz
Wasserstand vom 01.01.2022 bis zum 31.12.2022
| Datum | Mittelwert [cm] | Maximum [cm] | Minimum [cm] |
|---|---|---|---|
| 31.12.2022 | 225 | 227 | 222 |
| 30.12.2022 | 225 | 230 | 222 |
| 29.12.2022 | 233 | 236 | 230 |
| 28.12.2022 | 240 | 245 | 233 |
| 27.12.2022 | 253 | 262 | 245 |
| 26.12.2022 | 257 | 268 | 251 |
| 25.12.2022 | 278 | 287 | 268 |
© Bayerisches Landesamt für Umwelt 2025