
- Startseite >
- Flüsse >
- Wasserstand >
- Bayern >
- Dachau >
- Jahresgrafik

Jahresgrafik Dachau / Gröbenbach
Wasserstand vom 01.01.2021 bis zum 31.12.2021
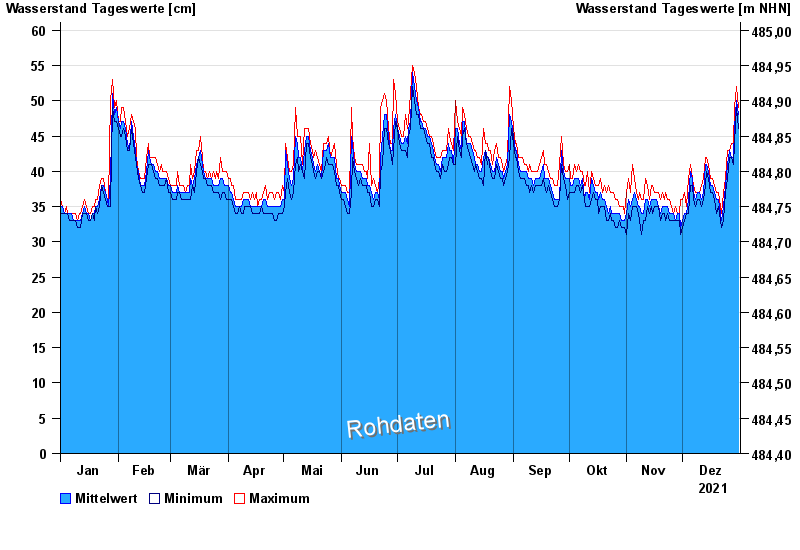
- Hochwassergefahrenfläche HQ100 120 cm
| Datum | Mittelwert [cm] | Maximum [cm] | Minimum [cm] |
|---|---|---|---|
| 31.12.2021 | 48 | 49 | 46 |
| 30.12.2021 | 50 | 52 | 49 |
| 29.12.2021 | 46 | 49 | 44 |
| 28.12.2021 | 42 | 44 | 41 |
| 27.12.2021 | 42 | 44 | 42 |
| 26.12.2021 | 43 | 43 | 42 |
| 25.12.2021 | 41 | 43 | 39 |
© Bayerisches Landesamt für Umwelt 2025