
- Startseite >
- Flüsse >
- Wasserstand >
- Bayern >
- Eberhardsreuth >
- Jahresgrafik

Jahresgrafik Eberhardsreuth / Mitternacher Ohe
Wasserstand vom 28.01.2024 bis zum 27.01.2025
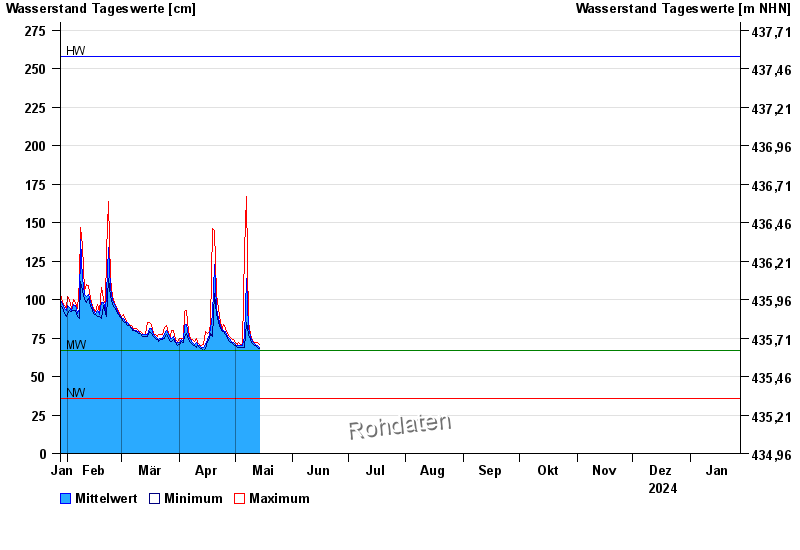
| Datum | Mittelwert [cm] | Maximum [cm] | Minimum [cm] |
|---|---|---|---|
| 13.07.2024 | 80 | 85 | 71 |
| 12.07.2024 | 71 | 75 | 69 |
| 11.07.2024 | 70 | 71 | 69 |
| 10.07.2024 | 71 | 73 | 69 |
| 09.07.2024 | 73 | 75 | 70 |
| 08.07.2024 | 78 | 84 | 74 |
| 07.07.2024 | 82 | 91 | 72 |
© Bayerisches Landesamt für Umwelt 2024