
- Startseite >
- Flüsse >
- Wasserstand >
- Bayern >
- Eggenfelden >
- Jahresgrafik

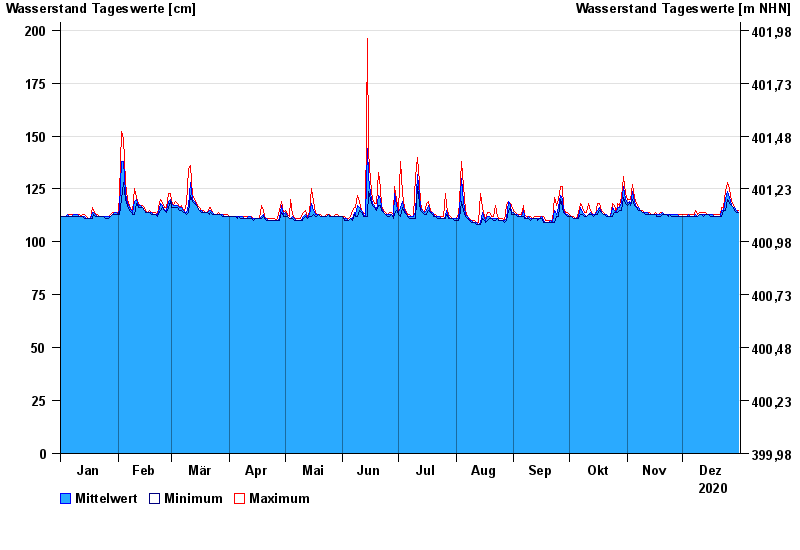
Jahresgrafik Eggenfelden / Mertseebach
Wasserstand vom 01.01.2020 bis zum 31.12.2020
- 02.03.1987 Wasserstand: 248 cm
- 13.01.2011 Wasserstand: 246 cm
- 02.06.2013 Wasserstand: 239 cm
- 02.08.1991 Wasserstand: 239 cm
- 14.04.1994 Wasserstand: 230 cm
| Datum | Mittelwert [cm] | Maximum [cm] | Minimum [cm] |
|---|---|---|---|
| 31.12.2020 | 114 | 115 | 114 |
| 30.12.2020 | 115 | 115 | 114 |
| 29.12.2020 | 116 | 116 | 115 |
| 28.12.2020 | 116 | 117 | 116 |
| 27.12.2020 | 117 | 119 | 117 |
| 26.12.2020 | 121 | 125 | 118 |
| 25.12.2020 | 124 | 128 | 120 |
© Bayerisches Landesamt für Umwelt 2025