
- Startseite >
- Flüsse >
- Wasserstand >
- Bayern >
- Eichstätt >
- Jahresgrafik

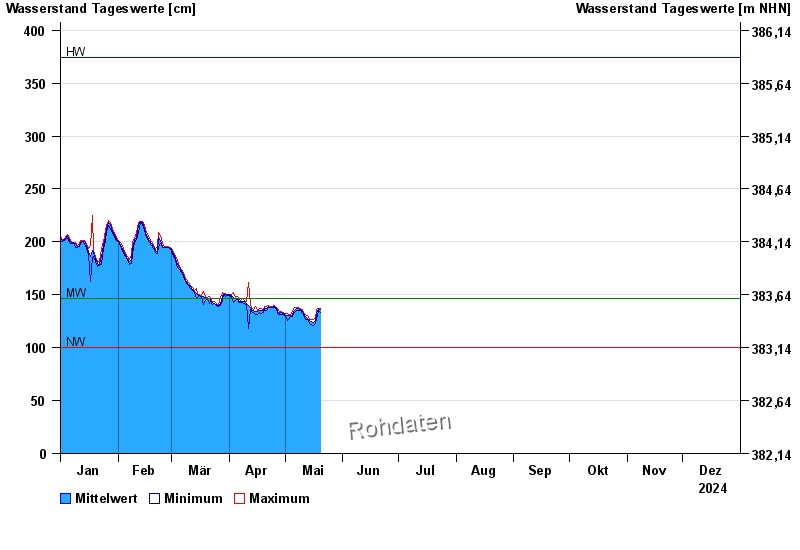
Jahresgrafik Eichstätt / Altmühl
Wasserstand vom 01.01.2024 bis zum 31.12.2024
| Datum | Mittelwert [cm] | Maximum [cm] | Minimum [cm] |
|---|---|---|---|
| 22.11.2024 | 151 | 152 | 150 |
| 21.11.2024 | 150 | 151 | 149 |
| 20.11.2024 | 139 | 149 | 134 |
| 19.11.2024 | 133 | 135 | 132 |
| 18.11.2024 | 132 | 132 | 131 |
| 17.11.2024 | 131 | 132 | 130 |
| 16.11.2024 | 132 | 133 | 130 |
© Bayerisches Landesamt für Umwelt 2024