
- Startseite >
- Flüsse >
- Wasserstand >
- Bayern >
- Eschelbach >
- Jahresgrafik

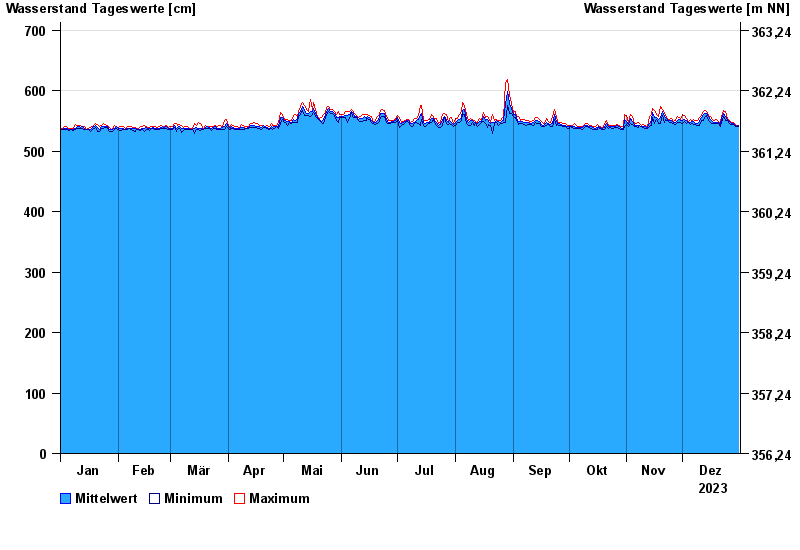
Jahresgrafik Eschelbach / Inn
Wasserstand vom 01.01.2023 bis zum 31.12.2023
- Hochwassergefahrenfläche HQ100 710 cm
| Datum | Mittelwert [cm] | Maximum [cm] | Minimum [cm] |
|---|---|---|---|
| 31.12.2023 | 542 | 543 | 540 |
| 30.12.2023 | 541 | 542 | 541 |
| 29.12.2023 | 544 | 546 | 542 |
| 28.12.2023 | 546 | 548 | 544 |
| 27.12.2023 | 546 | 548 | 544 |
| 26.12.2023 | 549 | 551 | 546 |
| 25.12.2023 | 552 | 554 | 550 |
© Bayerisches Landesamt für Umwelt 2025