
- Startseite >
- Flüsse >
- Wasserstand >
- Bayern >
- Fallmühle >
- Jahresgrafik

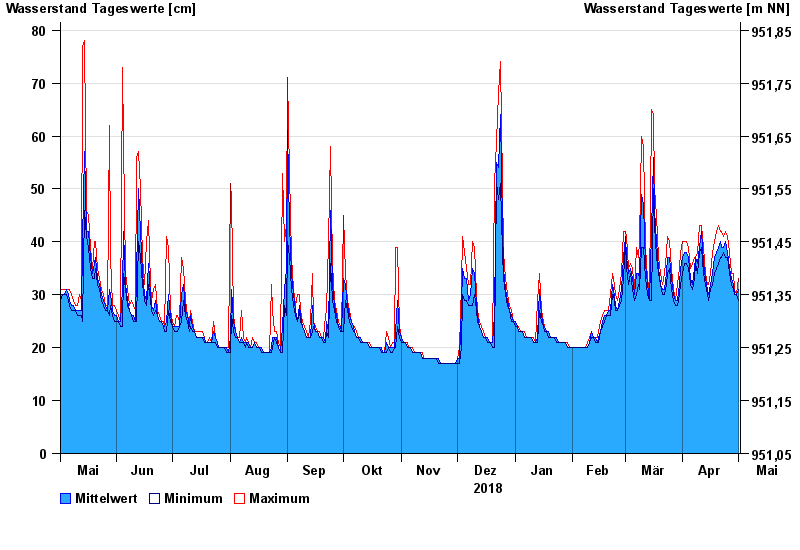
Jahresgrafik Fallmühle / Steinacher Achen
Wasserstand vom 02.05.2018 bis zum 01.05.2019
 Für diesen Pegel sind keine historische Ereignisse hinterlegt.
| Datum | Mittelwert [cm] | Maximum [cm] | Minimum [cm] |
|---|---|---|---|
| 01.05.2019 | 31 | 33 | 29 |
| 30.04.2019 | 30 | 30 | 30 |
| 29.04.2019 | 30 | 31 | 30 |
| 28.04.2019 | 32 | 34 | 31 |
| 27.04.2019 | 33 | 34 | 32 |
| 26.04.2019 | 35 | 38 | 34 |
| 25.04.2019 | 38 | 41 | 37 |
© Bayerisches Landesamt für Umwelt 2024