
- Startseite >
- Flüsse >
- Wasserstand >
- Bayern >
- Fallmühle >
- Jahresgrafik

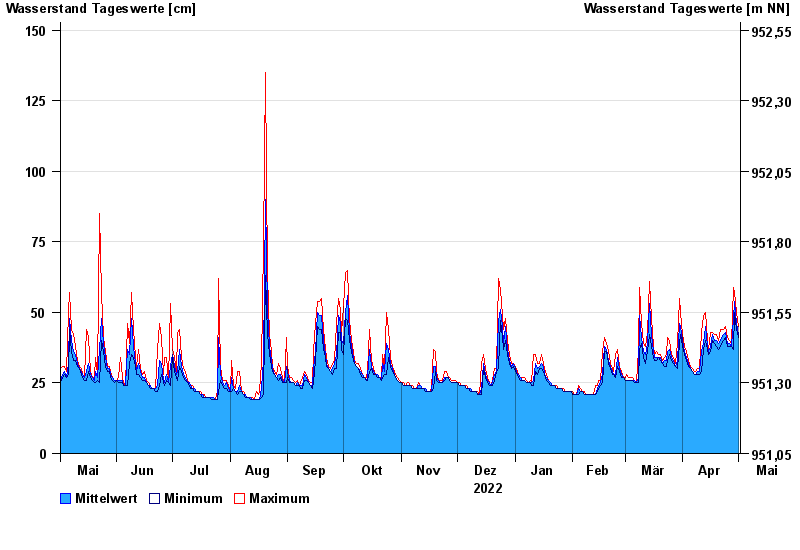
Jahresgrafik Fallmühle / Steinacher Achen
Wasserstand vom 02.05.2022 bis zum 01.05.2023
| Datum | Mittelwert [cm] | Maximum [cm] | Minimum [cm] |
|---|---|---|---|
| 01.05.2023 | 42 | 45 | 41 |
| 30.04.2023 | 46 | 50 | 44 |
| 29.04.2023 | 54 | 57 | 50 |
| 28.04.2023 | 48 | 59 | 37 |
| 27.04.2023 | 38 | 39 | 38 |
| 26.04.2023 | 39 | 40 | 38 |
| 25.04.2023 | 39 | 41 | 38 |
© Bayerisches Landesamt für Umwelt 2024