
- Startseite >
- Flüsse >
- Wasserstand >
- Bayern >
- Güntersthal >
- Jahresgrafik

Jahresgrafik Güntersthal / Pegnitz
Wasserstand vom 01.01.2021 bis zum 31.12.2021
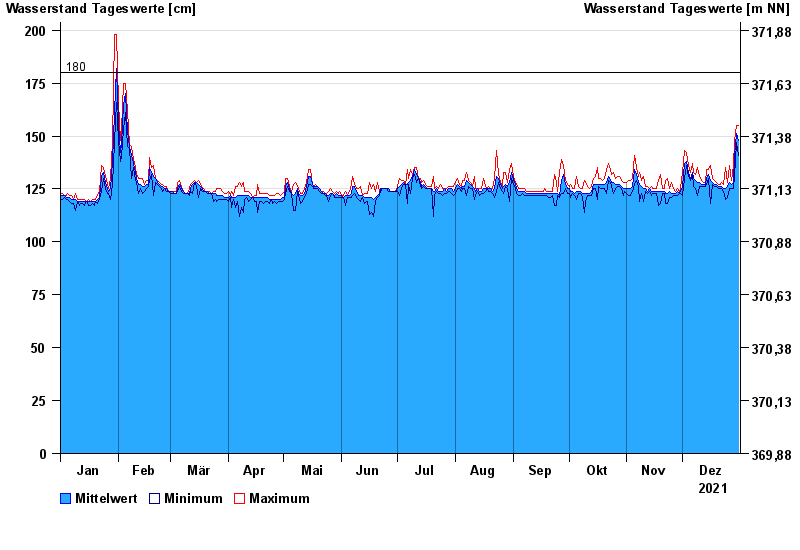
- 180 cm: Güntersthal: Beginn der Ausuferung.
| Datum | Mittelwert [cm] | Maximum [cm] | Minimum [cm] |
|---|---|---|---|
| 31.12.2021 | 148 | 155 | 141 |
| 30.12.2021 | 151 | 155 | 147 |
| 29.12.2021 | 141 | 148 | 131 |
| 28.12.2021 | 128 | 136 | 125 |
| 27.12.2021 | 127 | 129 | 125 |
| 26.12.2021 | 128 | 136 | 125 |
| 25.12.2021 | 126 | 128 | 121 |
© Bayerisches Landesamt für Umwelt 2025