
- Startseite >
- Flüsse >
- Wasserstand >
- Bayern >
- Hechendorf >
- Jahresgrafik

Jahresgrafik Hechendorf / Ramsach
Wasserstand vom 31.07.2019 bis zum 30.07.2020
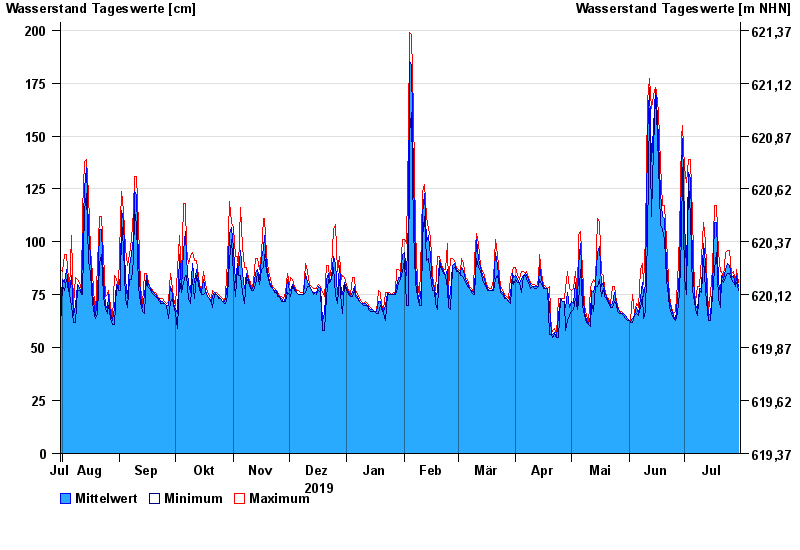
Hinweis
Messwerte beeinflusst durch Kraftwerkssteuerungen.
| Datum | Mittelwert [cm] | Maximum [cm] | Minimum [cm] |
|---|---|---|---|
| 30.07.2020 | 79 | 81 | 77 |
| 29.07.2020 | 84 | 87 | 81 |
| 28.07.2020 | 79 | 81 | 79 |
| 27.07.2020 | 84 | 86 | 81 |
| 26.07.2020 | 83 | 85 | 82 |
| 25.07.2020 | 89 | 96 | 85 |
| 24.07.2020 | 90 | 96 | 85 |
© Bayerisches Landesamt für Umwelt 2024