
- Startseite >
- Flüsse >
- Wasserstand >
- Bayern >
- Illesheim >
- Jahresgrafik

Jahresgrafik Illesheim / Aisch
Wasserstand vom 01.01.2020 bis zum 31.12.2020
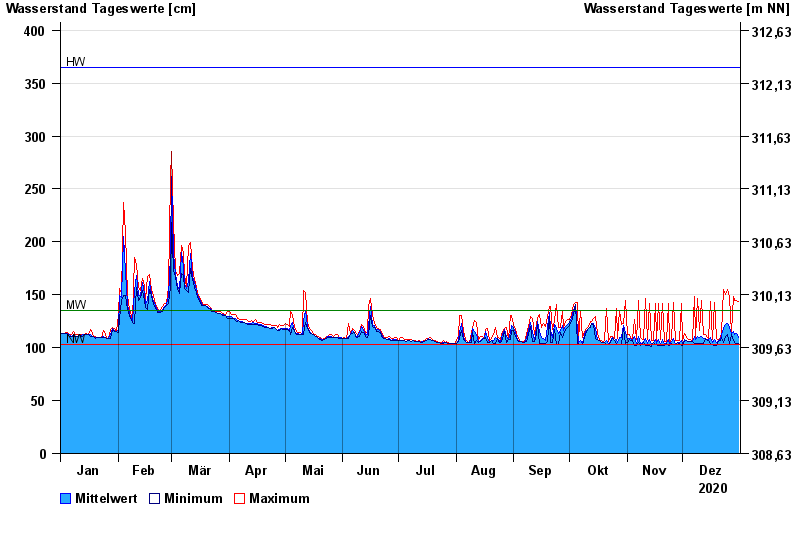
Hinweis
Wasserstand und Abfluss wird zeitweise durch Biberdamm beeinflusst.
| Datum | Mittelwert [cm] | Maximum [cm] | Minimum [cm] |
|---|---|---|---|
| 31.12.2020 | 110 | 144 | 104 |
| 30.12.2020 | 113 | 145 | 104 |
| 29.12.2020 | 112 | 145 | 105 |
| 28.12.2020 | 115 | 148 | 107 |
| 27.12.2020 | 113 | 114 | 112 |
| 26.12.2020 | 119 | 147 | 104 |
| 25.12.2020 | 123 | 155 | 112 |
© Bayerisches Landesamt für Umwelt 2025