
- Startseite >
- Flüsse >
- Wasserstand >
- Bayern >
- Kinning >
- Jahresgrafik

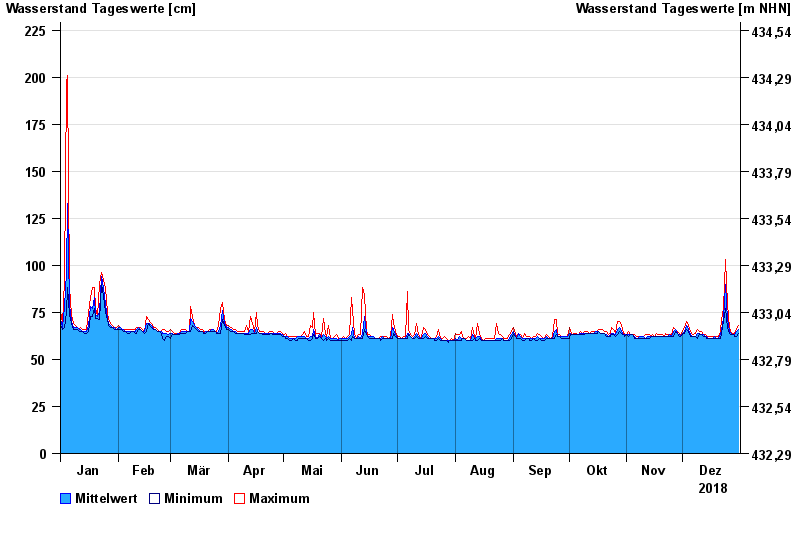
Jahresgrafik Kinning / Rott
Wasserstand vom 01.01.2018 bis zum 31.12.2018
- 13.01.2004 Wasserstand: 339 cm
- 02.06.2013 Wasserstand: 314 cm
- 05.07.1975 Wasserstand: 309 cm
- 01.08.1991 Wasserstand: 291 cm
- 15.02.1990 Wasserstand: 286 cm
| Datum | Mittelwert [cm] | Maximum [cm] | Minimum [cm] |
|---|---|---|---|
| 31.12.2018 | 66 | 68 | 64 |
| 30.12.2018 | 65 | 66 | 62 |
| 29.12.2018 | 63 | 64 | 62 |
| 28.12.2018 | 63 | 64 | 63 |
| 27.12.2018 | 64 | 64 | 63 |
| 26.12.2018 | 65 | 67 | 64 |
| 25.12.2018 | 71 | 79 | 67 |
© Bayerisches Landesamt für Umwelt 2024