
- Startseite >
- Flüsse >
- Wasserstand >
- Bayern >
- Landau >
- Jahresgrafik

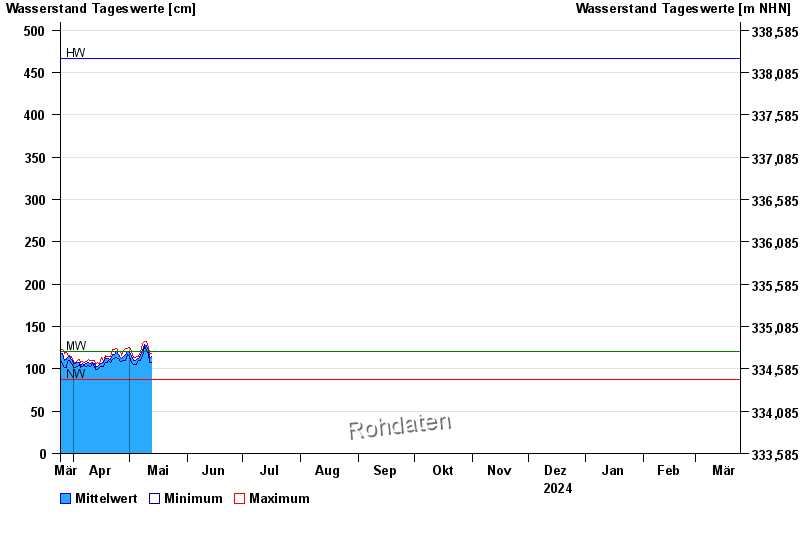
Jahresgrafik Landau / Isar
Wasserstand vom 25.03.2024 bis zum 24.03.2025
| Datum | Mittelwert [cm] | Maximum [cm] | Minimum [cm] |
|---|---|---|---|
| 09.08.2024 | 122 | 126 | 118 |
| 08.08.2024 | 118 | 121 | 114 |
| 07.08.2024 | 114 | 121 | 111 |
| 06.08.2024 | 116 | 122 | 110 |
| 05.08.2024 | 117 | 122 | 113 |
| 04.08.2024 | 125 | 128 | 117 |
| 03.08.2024 | 123 | 127 | 120 |
© Bayerisches Landesamt für Umwelt 2024