
- Startseite >
- Flüsse >
- Wasserstand >
- Bayern >
- Landsberg >
- Jahresgrafik

Jahresgrafik Landsberg / Lech
Wasserstand vom 01.01.2022 bis zum 31.12.2022
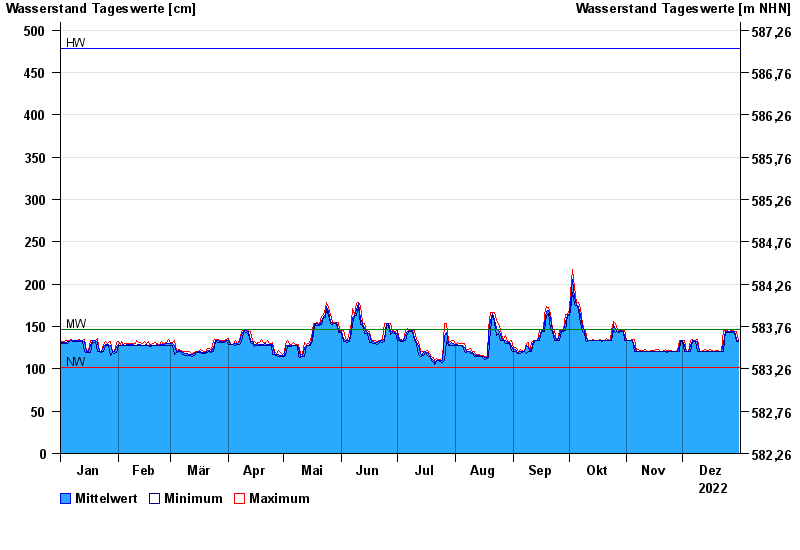
Hinweis
Messwerte beeinflusst durch Kraftwerkssteuerung.
| Datum | Mittelwert [cm] | Maximum [cm] | Minimum [cm] |
|---|---|---|---|
| 31.12.2022 | 133 | 133 | 132 |
| 30.12.2022 | 135 | 144 | 132 |
| 29.12.2022 | 144 | 144 | 143 |
| 28.12.2022 | 144 | 145 | 143 |
| 27.12.2022 | 144 | 145 | 143 |
| 26.12.2022 | 144 | 144 | 143 |
| 25.12.2022 | 144 | 145 | 143 |
© Bayerisches Landesamt für Umwelt 2025