
- Startseite >
- Flüsse >
- Wasserstand >
- Bayern >
- Neumühle >
- Jahresgrafik

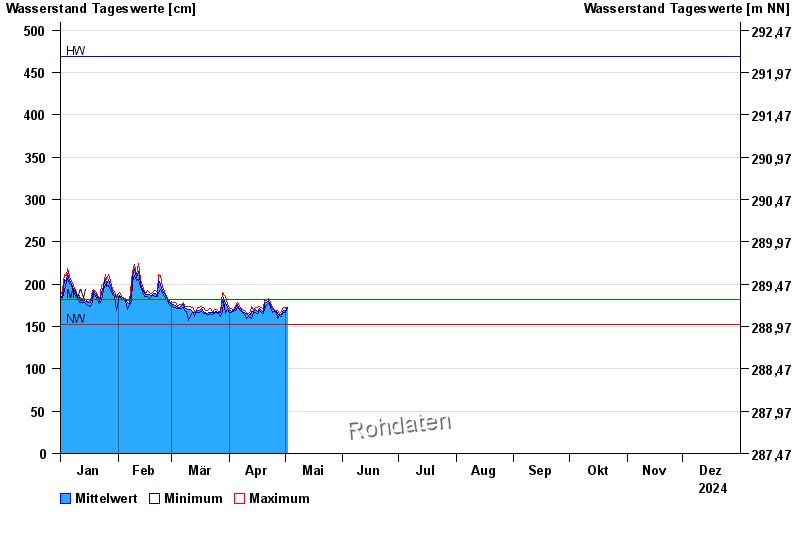
Jahresgrafik Neumühle / Rednitz
Wasserstand vom 01.01.2024 bis zum 31.12.2024
| Datum | Mittelwert [cm] | Maximum [cm] | Minimum [cm] |
|---|---|---|---|
| 09.08.2024 | 178 | 181 | 175 |
| 08.08.2024 | 180 | 183 | 176 |
| 07.08.2024 | 180 | 182 | 172 |
| 06.08.2024 | 179 | 182 | 175 |
| 05.08.2024 | 179 | 183 | 172 |
| 04.08.2024 | 181 | 184 | 179 |
| 03.08.2024 | 177 | 180 | 176 |
© Bayerisches Landesamt für Umwelt 2024