
- Startseite >
- Flüsse >
- Wasserstand >
- Bayern >
- Obermühlhausen >
- Jahresgrafik

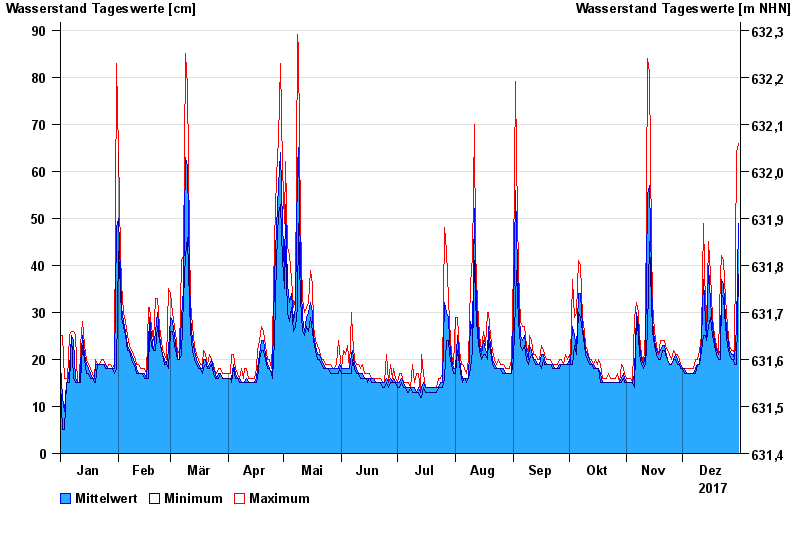
Jahresgrafik Obermühlhausen / Windach
Wasserstand vom 01.01.2017 bis zum 31.12.2017
- 21.05.1999 Wasserstand: 183 cm
- 06.08.2000 Wasserstand: 166 cm
- 02.06.2013 Wasserstand: 152 cm
- 17.06.1979 Wasserstand: 152 cm
- 13.04.1994 Wasserstand: 145 cm
| Datum | Mittelwert [cm] | Maximum [cm] | Minimum [cm] |
|---|---|---|---|
| 31.12.2017 | 49 | 66 | 38 |
| 30.12.2017 | 27 | 64 | 19 |
| 29.12.2017 | 20 | 21 | 19 |
| 28.12.2017 | 21 | 22 | 20 |
| 27.12.2017 | 21 | 22 | 20 |
| 26.12.2017 | 22 | 23 | 21 |
| 25.12.2017 | 25 | 27 | 23 |
© Bayerisches Landesamt für Umwelt 2025