
- Startseite >
- Flüsse >
- Wasserstand >
- Bayern >
- Passau >
- Jahresgrafik

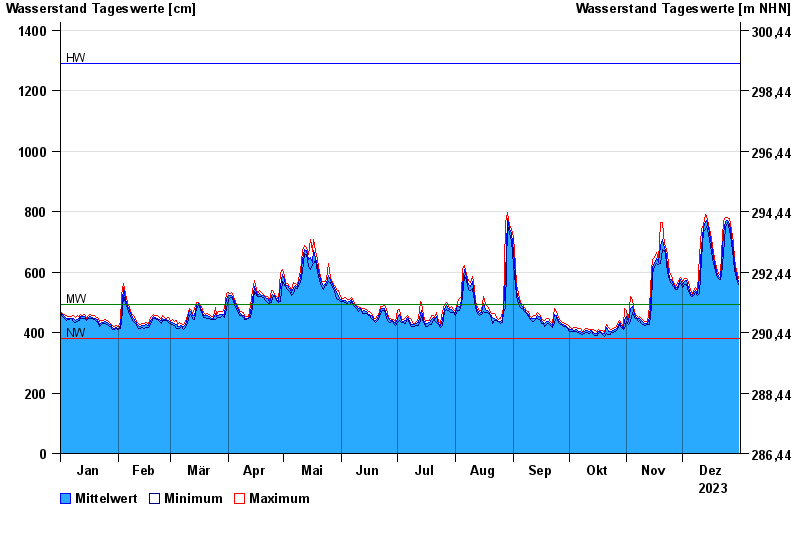
Jahresgrafik Passau / Donau
Wasserstand vom 01.01.2023 bis zum 31.12.2023
| Datum | Mittelwert [cm] | Maximum [cm] | Minimum [cm] |
|---|---|---|---|
| 31.12.2023 | 570 | 578 | 560 |
| 30.12.2023 | 591 | 605 | 578 |
| 29.12.2023 | 626 | 641 | 605 |
| 28.12.2023 | 670 | 697 | 641 |
| 27.12.2023 | 717 | 737 | 697 |
| 26.12.2023 | 757 | 778 | 736 |
| 25.12.2023 | 769 | 779 | 763 |
© Bayerisches Landesamt für Umwelt 2025