
- Startseite >
- Flüsse >
- Wasserstand >
- Bayern >
- Prien >
- Jahresgrafik

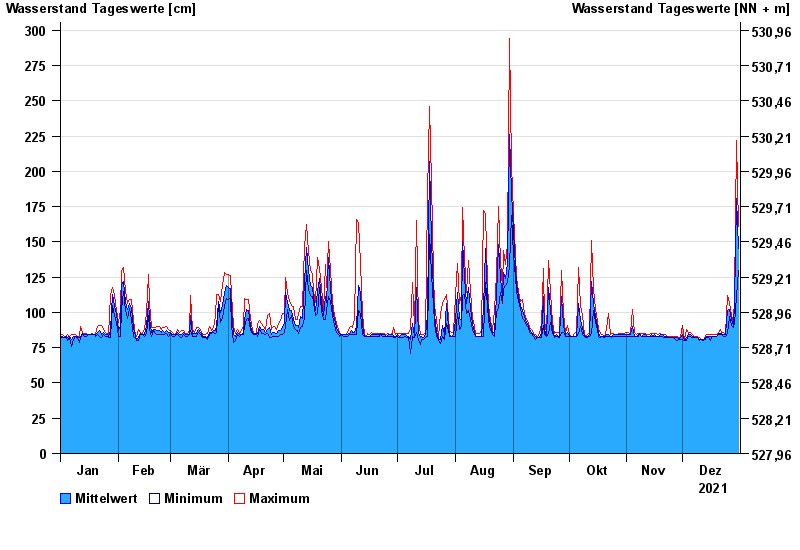
Jahresgrafik Prien / Prien
Wasserstand vom 01.01.2021 bis zum 31.12.2021
- 02.06.2013 Wasserstand: 422 cm
- 12.08.2002 Wasserstand: 419 cm
- 03.06.2010 Wasserstand: 382 cm
- 04.08.2020 Wasserstand: 369 cm
- 20.07.1981 Wasserstand: 350 cm
| Datum | Mittelwert [cm] | Maximum [cm] | Minimum [cm] |
|---|---|---|---|
| 31.12.2021 | 145 | 161 | 130 |
| 30.12.2021 | 181 | 222 | 111 |
| 29.12.2021 | 106 | 111 | 92 |
| 28.12.2021 | 91 | 93 | 89 |
| 27.12.2021 | 95 | 98 | 91 |
| 26.12.2021 | 102 | 106 | 97 |
| 25.12.2021 | 101 | 112 | 85 |
© Bayerisches Landesamt für Umwelt 2025