
- Startseite >
- Flüsse >
- Wasserstand >
- Bayern >
- Puppling >
- Jahresgrafik

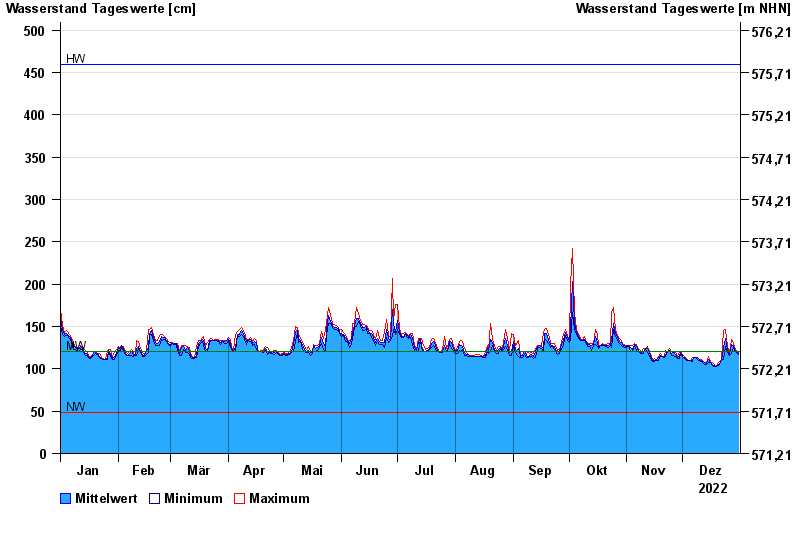
Jahresgrafik Puppling / Isar
Wasserstand vom 01.01.2022 bis zum 31.12.2022
| Datum | Mittelwert [cm] | Maximum [cm] | Minimum [cm] |
|---|---|---|---|
| 31.12.2022 | 118 | 119 | 117 |
| 30.12.2022 | 121 | 122 | 119 |
| 29.12.2022 | 123 | 125 | 122 |
| 28.12.2022 | 128 | 131 | 125 |
| 27.12.2022 | 129 | 135 | 118 |
| 26.12.2022 | 117 | 119 | 116 |
| 25.12.2022 | 122 | 126 | 119 |
© Bayerisches Landesamt für Umwelt 2025